Europe's river drought 2026: where water is short and by how much
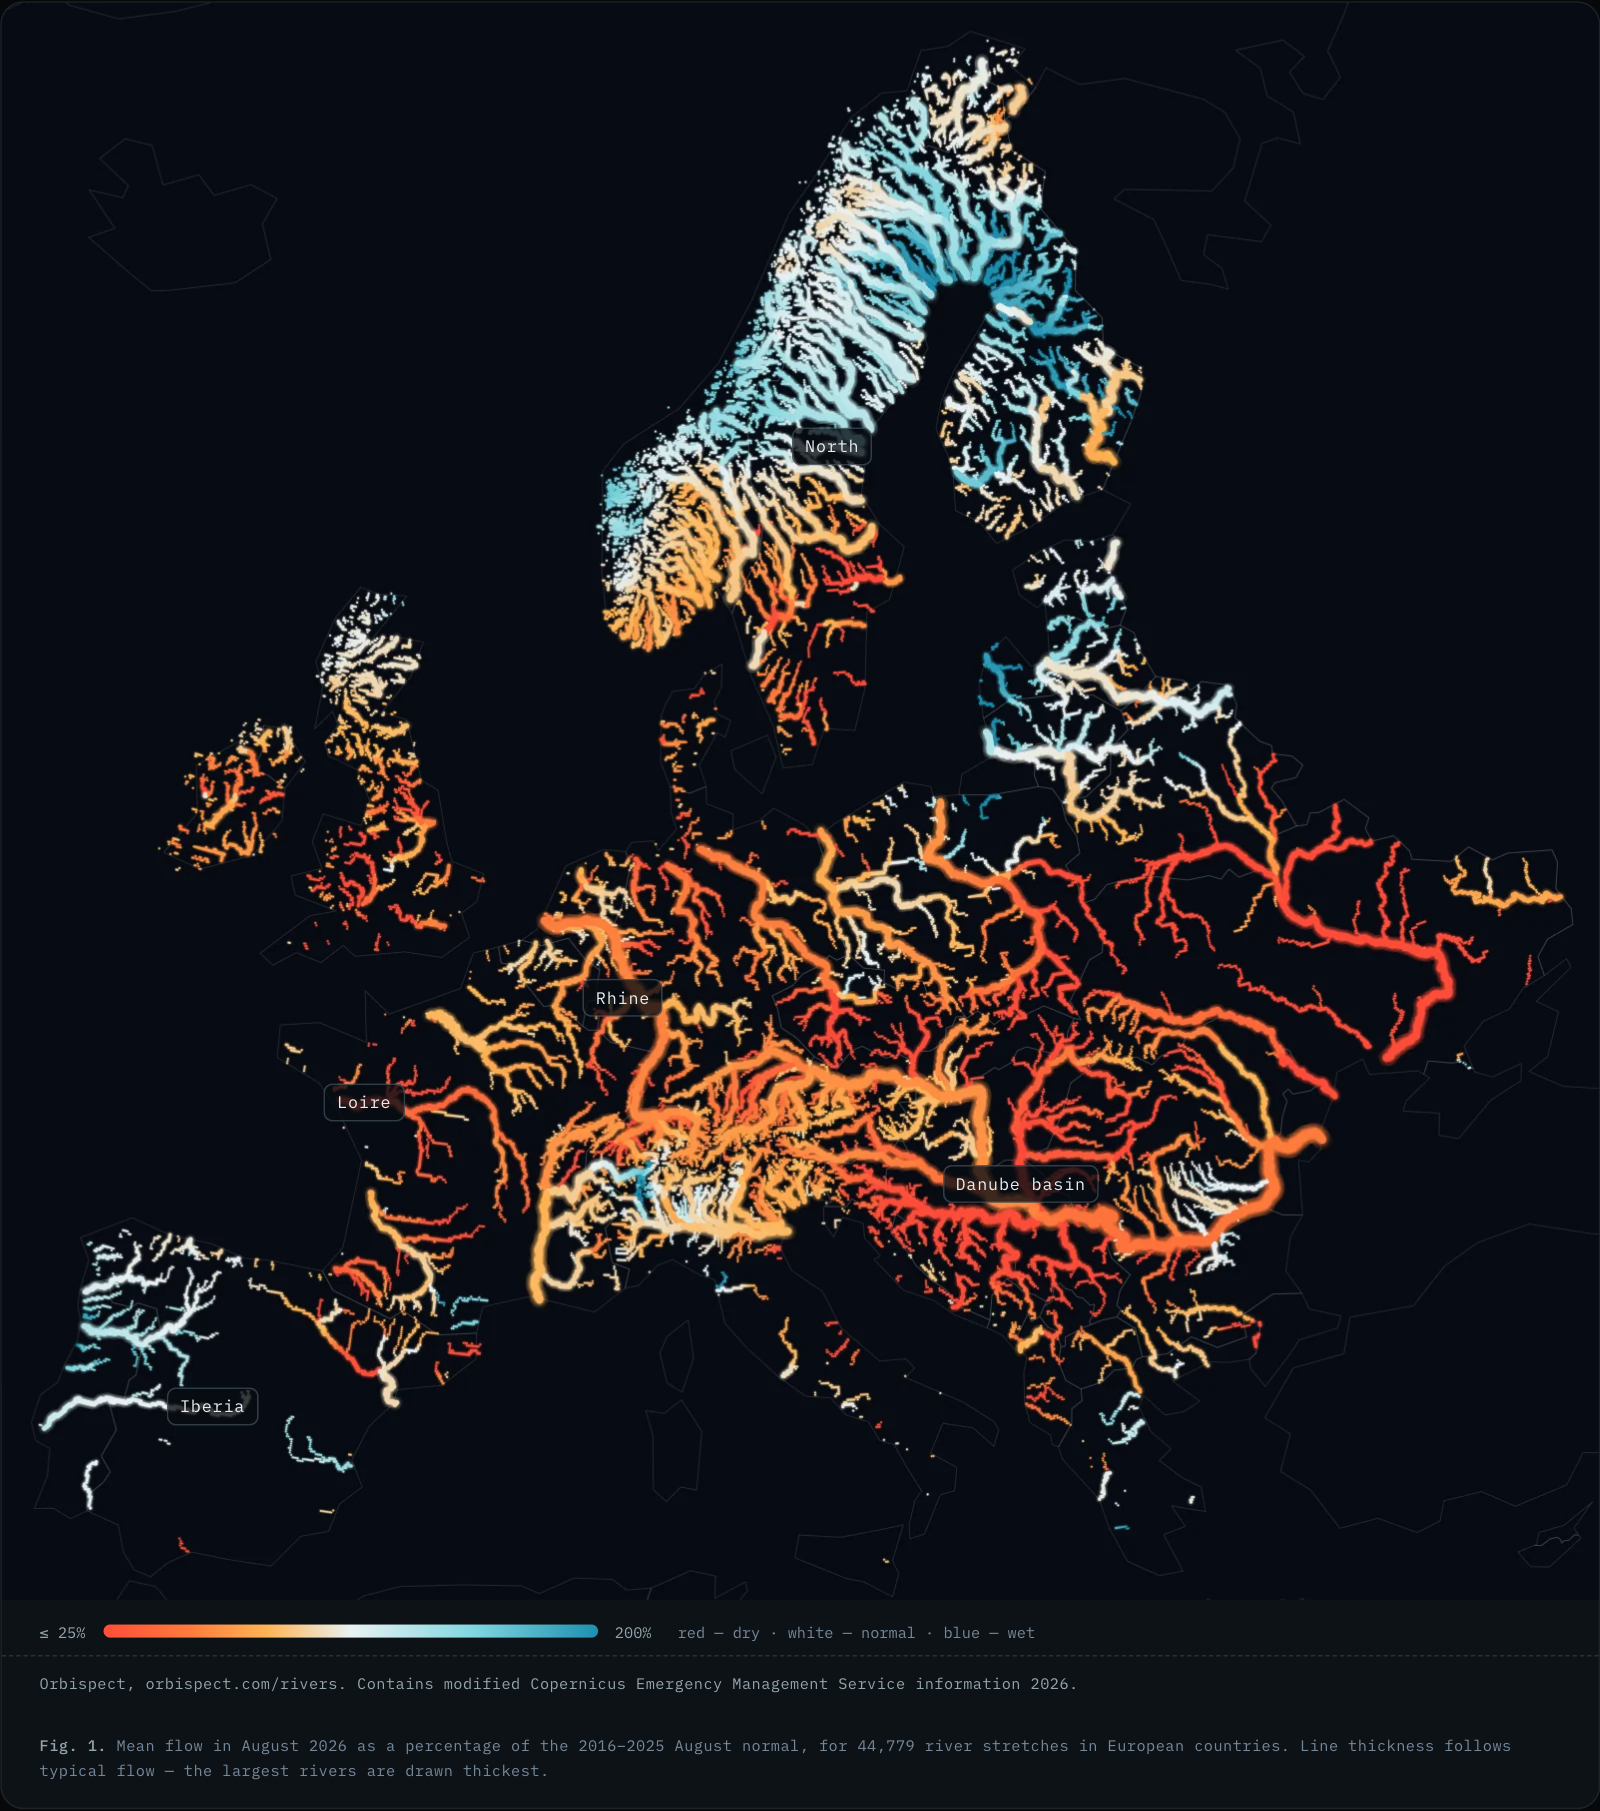
In August 2026 rivers across most of Europe carried clearly less water than usual. The situation was hardest in the Balkans, the Danube basin, Czechia, Ukraine, Germany and France. In the north of Europe, however, water levels in rivers were closer to normal, except in southern Sweden.
The report shows where water shortages occurred and how large they were. It covers a map of 44,779 river reaches, data from 27 countries and 23 large rivers, as well as a separate analysis of Poland. The map covers 37 countries, while the tables and charts concern 27 of them, in which there are at least 300 river reaches. Satellite images showing the situation before and after the changes, among others on the Rhine, the Po and in the Alps, complete the picture.
The values come from the Copernicus model, not from gauge readings. The model results were compared with gauge measurements in three countries.
- 32%of river reaches in Europe had less than half of normal flow in August.
- 11%of normal: the water the typical river in Serbia carried, the lowest of 27 countries.
- 20 of 27countries still below normal in September, despite a slight improvement.
KEY POINTS
- Poland: In August 2026 the typical river reach in Poland had 54% of its 2016-2025 normal flow, and on 48% of reaches the flow fell below half of the 1991-2020 normal. Details
- Lowest August in the 2016-2026 series: In the European countries covered by the analysis (excluding Russia and Turkey), the typical river reach had only 70% of its normal flow in August 2026, measured against the August 2016-2025 average. For comparison, in the second driest year (2019) it was 75%. Against the 1991-2020 norm it was the third lowest August since 1991.
- Almost a third of the network below half of normal: As many as 32% of river reaches had less than half of their normal flow. This is a record share in the 2016-2026 series, because in 2018 it was 23%.
- Record-low water levels on the large rivers: The Danube at Budapest, the Rhine, Sava, Tisza, Loire, Po and Rhône had their driest August since 2016.
- A divided continent: In Germany the typical river reach had 44% of normal flow, in France 54%, in Czechia 24% and in Serbia only 11%. In Finland, by contrast, flow was 112% of normal and in Portugal 121%. In Sweden the model indicated 106% of normal, although gauge data showed drought in the south of the country.
- No relief in September in the west and centre: Through 27 September the typical river in France had a flow of only 39% of normal and in Germany 49%. In the Baltic countries and Finland, by contrast, flows were clearly above normal.
- Widest drought since 1991 in the model: Against the long-term 1991-2020 norm, as many as 35% of river reaches had less than half of their normal flow. This is a larger share than in 2003 and 1994.
- The Rhine at Kaub below its former record: On 1 October the gauge read −6 cm (a gauge zero does not mean there is no water, because it is a conventional reference point). The previous record minimum was 25 cm, recorded in 2018.
How to read “% of normal” and the model
Normal is the average river flow in August at a given place in the years 2016-2025. 100% means typical flow, 50% means half of that value and 150% one and a half times as much. These are model estimates, not direct gauge readings. It is worth remembering that “normal” here refers to the last 10 years, not to a long-term climate norm. “Record” on the charts means the lowest August flow since 2016 at a given place, not a record in the long-term sense.
- Normal
- the average river flow in August at the same place in 2016-2025.
- Model
- a program that computes river flow from weather and terrain, not a gauge reading.
- River reach
- one cell of the model grid, about 5 km of river.
- Median
- the value below which half of the reaches lie and above which the other half lie.
- Meteorological drought
- A long spell with less rain than usual.
- Hydrological drought
- Too little water in rivers, lakes and underground. It follows a shortage of rain with a delay; this report looks at it in rivers.
Two norms. The main comparison is the 2016-2025 norm, and in addition, in the section on the longer term, data are given against the 1991-2020 norm.
Three meanings of “% of normal”. It is worth remembering that “% of normal” does not always mean the same thing. For Europe or a country it is the median of many river reaches, each compared with its own norm, which is why the typical reach had, for example, 70% of normal. For a single river, such as the Sava or the Danube at Budapest, it is the average August flow at one point compared with the norm for that same point. On the daily chart and for September it means the flow of a given day or period compared with the norm for the same period in 2016-2025. The 1991-2020 norm is a separate case, always indicated in the text, which is why the same August results have different values there (for example 72% instead of 70%).
The model is a program that computes river flow day by day from measured weather and terrain. A measurement is a gauge reading, and the figures used in the report come from the model, not from a measurement. The model record since 1991 contains computed data for rivers in the Europe covered by the analysis (excluding Russia, Turkey and Iceland), also where there are no gauges. These are estimates, not direct measurements. In Germany and Sweden the model overestimates flow at low water (in Germany the median overestimate is about 22% against 11 gauges), while in the United Kingdom it underestimates it. That is why the text says “in the model”, and “since 1991” means the start of the model record, not the history of measurements. A comparison with gauge readings in three countries showed a wide range of agreement: the correlation was 0.91-0.99 on the Rhine, 0.80 in Sweden and 0.09 in the United Kingdom. Details
The Copernicus model is not Orbispect's own model. It is a pan-European flow model provided through the CEMS emergency management service and used in line with its licence. Orbispect carries out the analysis of the model's results: determining norms, comparisons with other years, country summaries, satellite images before and after, and verification of the data against gauge readings.
River reach. In the report it means one cell of the model grid about 5 km in size, covering a river with a typical flow above about 3 m³/s. In total, 44,779 reaches in 37 countries were analysed. The country data concern 27 countries with at least 300 such reaches (43,354 in total), and the remaining 10 countries have 1,425 reaches between them. When calculating a country's median, small and large rivers were treated alike, because reaches were not weighted by flow. The exception is the table on river basins (section “River basins in numbers”), in which a reach is a stretch of river usually 60-100 km long, made up of several cells of the model grid.
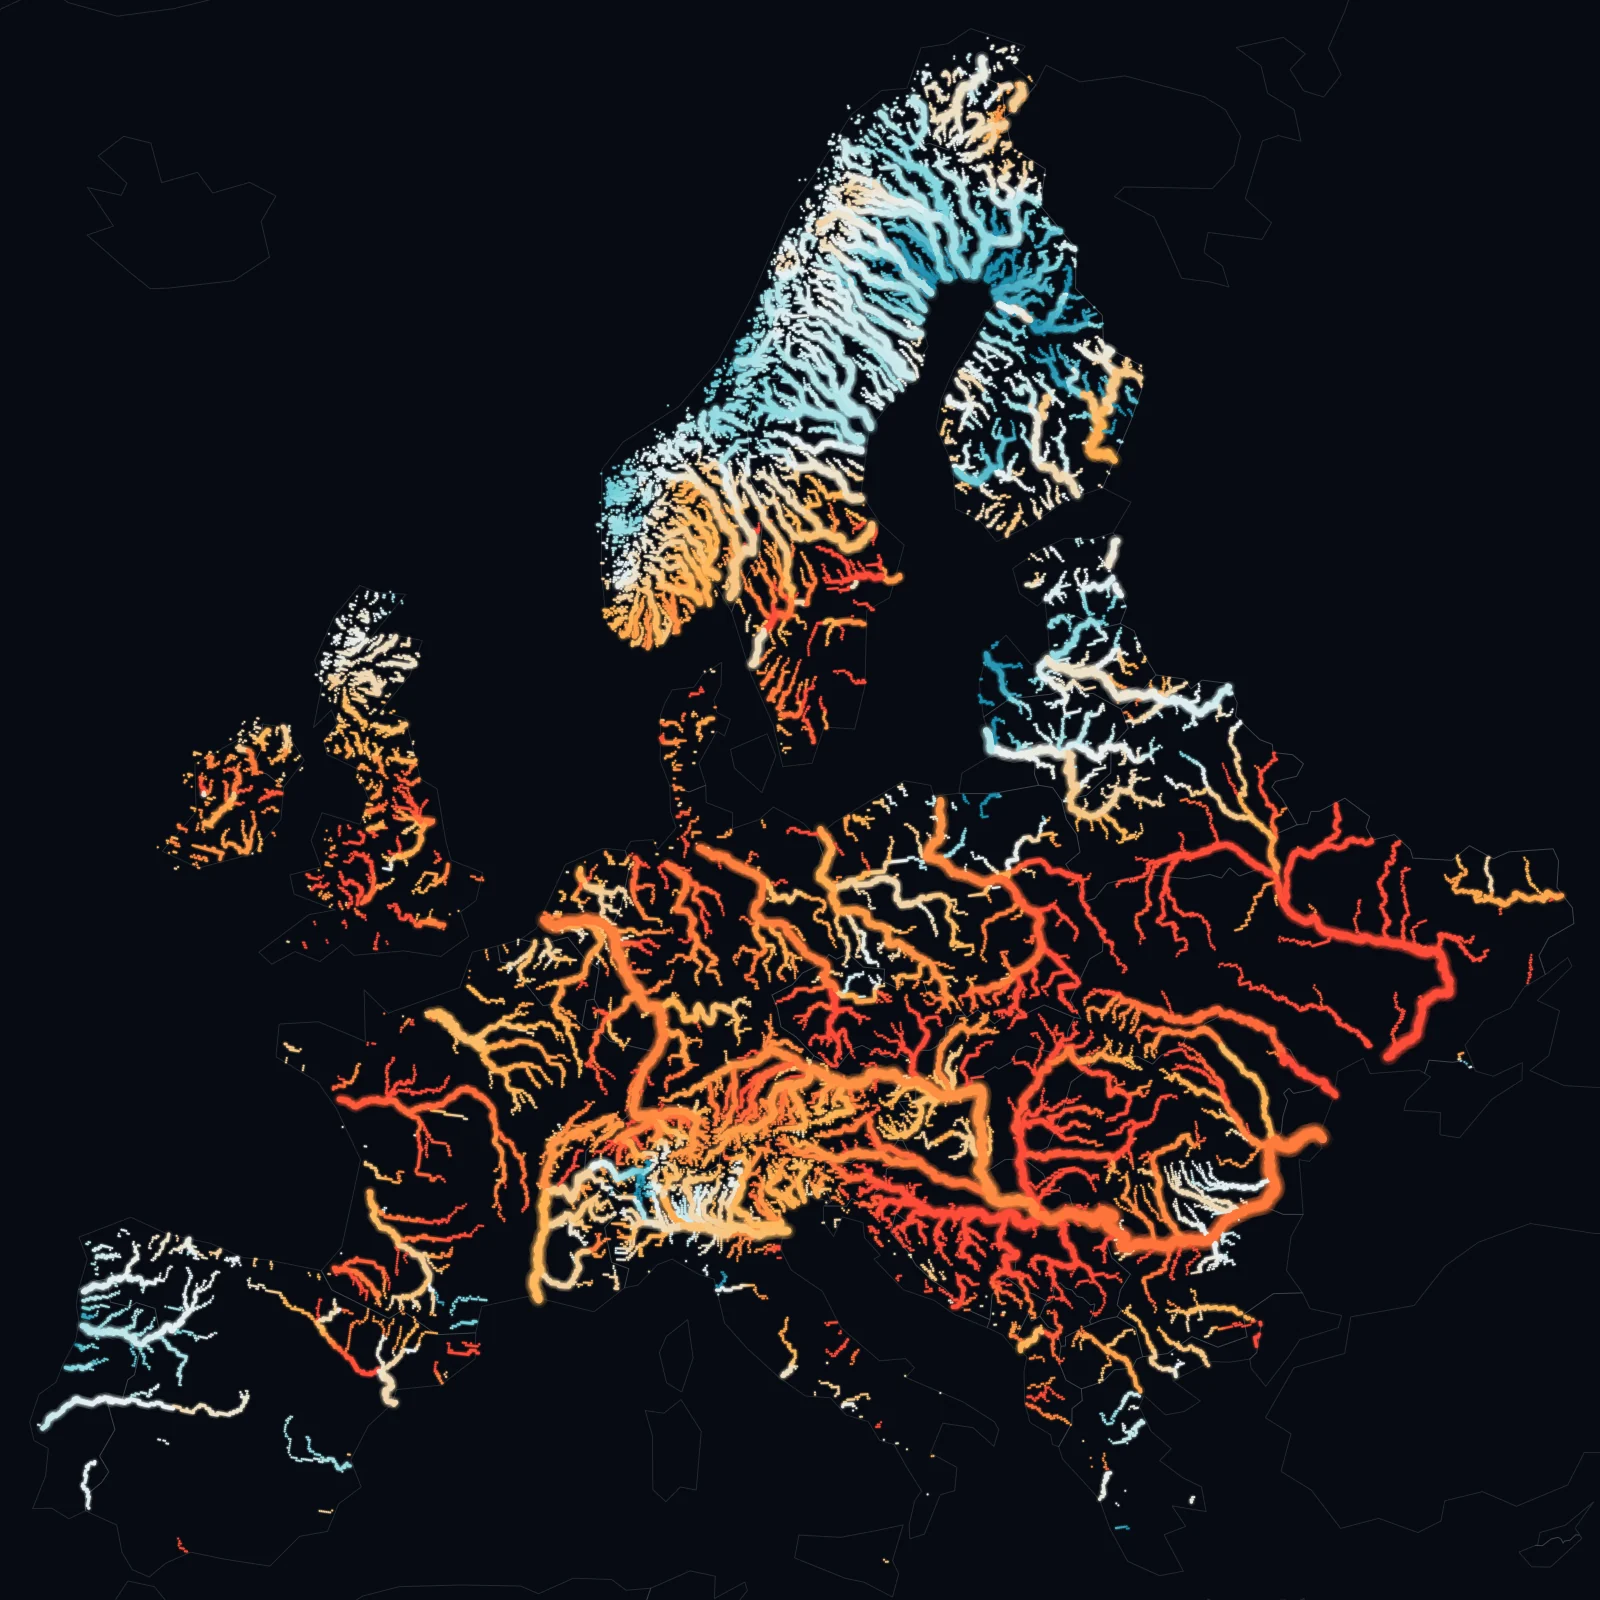
Explore the map
Hover over or tap a river to see its reach: August 2026 flow as a percentage of normal, the record of the Augusts since 2016 and the profile of the whole river. Or pick a river or a country.
What can you see on the map? Each line represents a river reach. The colour shows how much water flowed in August 2026 compared with a typical August of the last decade: red means drought, white means normal and blue means wet. Hover over a river or tap it to see information about the reach. Line thickness corresponds to the size of the river, so thick red lines indicate shortages also on large rivers. The map shows a belt of water shortage stretching from the Balkans to the British Isles and a relatively good situation in the north of Europe. Use the + and − buttons to zoom the map in or out. You can choose a country or a river from the list next to it.
What lies behind the drought and what are its effects?
Weather
The summer was the hardest in terms of the lowest river flows since the start of the record in 1992. The Copernicus bulletin counts its record from 1992, and the record of the model used in the report begins in 1991. Record-low or near-record values were noted on the Rhine, Danube, Po, Loire, Rhône and Seine[1]. In western Europe it was the warmest summer on record, warmer even than in 2003[1]. The causes were little snow in Switzerland, a rainfall deficit since spring and heat waves[1][2].
Effects
The effects of the drought were felt among others by the energy sector and river transport, which depend on adequate water levels and temperature. The Hungarian nuclear power plant Paks reduced output from the end of July and returned to full capacity around 26 August[3][4]. In France three reactors were shut down at the Bugey, Golfech and Chooz plants because of excessively high river water temperatures[5]. On the Rhine ships could carry only about one fifth of their usual load[6].
What was done
In some cantons, including Solothurn, bans on water abstraction were introduced, also for irrigation[14]. The analysis focuses on river flows and does not determine to what extent climate change contributed to the drought.
Where it is better
August was wetter than average in the west of the Iberian Peninsula, in the Alps, in the north-east of Europe and in Scandinavia and Finland[9].
Why low water levels matter
Low water affects not only the rivers themselves but also people's daily lives, the functioning of the economy and the condition of ecosystems. Barges have to carry smaller loads or stop sailing, power plants that use water for cooling reduce output, and hydropower plants produce less energy. Waterworks and agriculture also compete for water. Higher water temperature can additionally harm fish and other aquatic organisms.
Selected rivers in the model
In August 2026 the modelled flow was the lowest since 1991 on the Danube at Budapest (48% of the 2016-2025 norm) and on the Rhône at Beaucaire (65%). On the Rhine at Lobith it was 42%, on the Elbe at Neu Darchau 42% (second lowest August since 1991), on the Oder at Hohensaaten 59% (sixth), on the Po at Pontelagoscuro 68% (sixth). The figures come from the model at the nearest point on the same river.
Hydrological drought 2026: where flow fell furthest
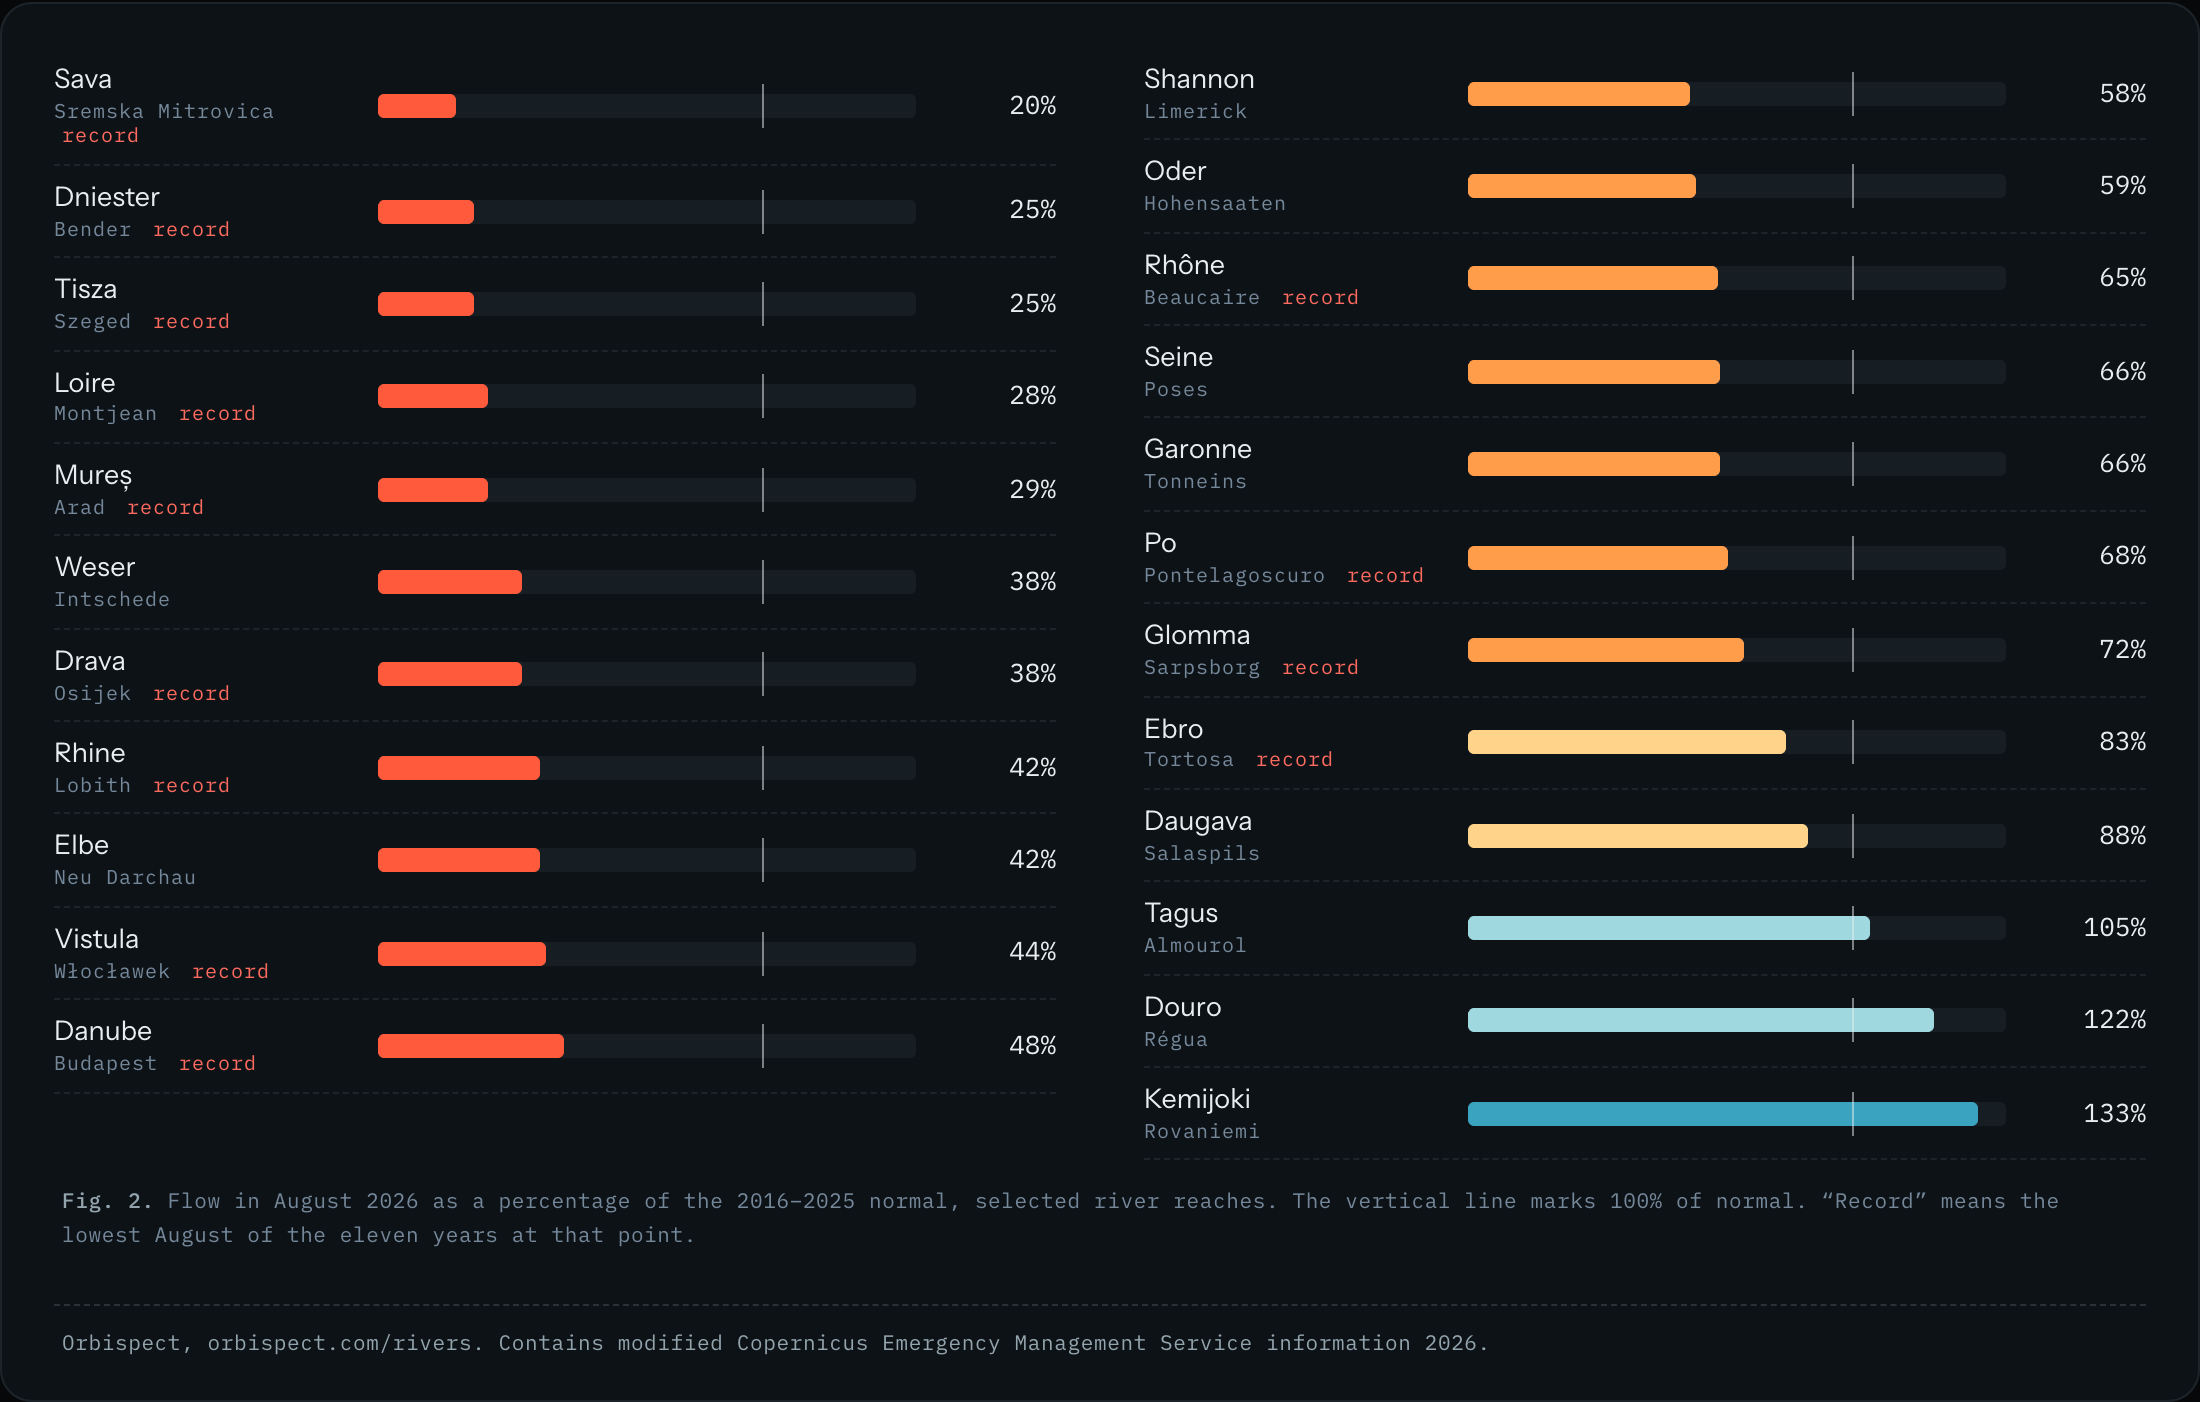
Many of the lowest values among the large rivers occurred in the Danube basin. The Danube at Budapest had, according to the model, a flow reduced to 48% of normal, or on average 1,313 m³/s. Not only the Danube had its driest August since 2016, but also the Sava, Tisza, Mureș and Drava. The Sava at Sremska Mitrovica had 20% of normal, the Tisza at Szeged 25%, the Mureș at Arad 29% and the Drava at Osijek 38%.
West of it, the Loire at Montjean ran at 28% of normal, the Weser at 38%, the Rhine at Lobith at 42% and the Elbe at 42%; the Vistula at Włocławek stood at 44%. The Rhône, Po and Seine held higher, at 65-68%, but the Rhône and the Po still recorded their lowest August in the series and the Seine its second lowest.
The exceptions lay at the edges of Europe: on the Iberian Peninsula, in Portugal, the flow of the Douro at Régua was 122% of normal and of the Tagus at Almourol 105%. In Finnish Lapland, in turn, the Kemijoki reached as much as 133% of normal.
How to read the bars. Each bar shows one river reach. The length of the bar shows the flow in August 2026 as a percentage of normal, and the vertical line marks 100%, that is, typical flow. A bar shorter than the line indicates that there was less water than usual. The “record” label means that at that place no August since 2016 was as dry. The lowest values were recorded on the Sava (20% of normal), the Dniester (25%) and the Tisza (25%). The Sava and the Tisza belong to the Danube basin, while the Dniester has its own basin. This means that the flow was about one quarter of normal or less. The highest values were reached by the Kemijoki in Finland (133%) and the Douro in Portugal (122%). The filter above the chart lets you search for rivers by name or by flow value.
Which countries felt hydrological drought most?
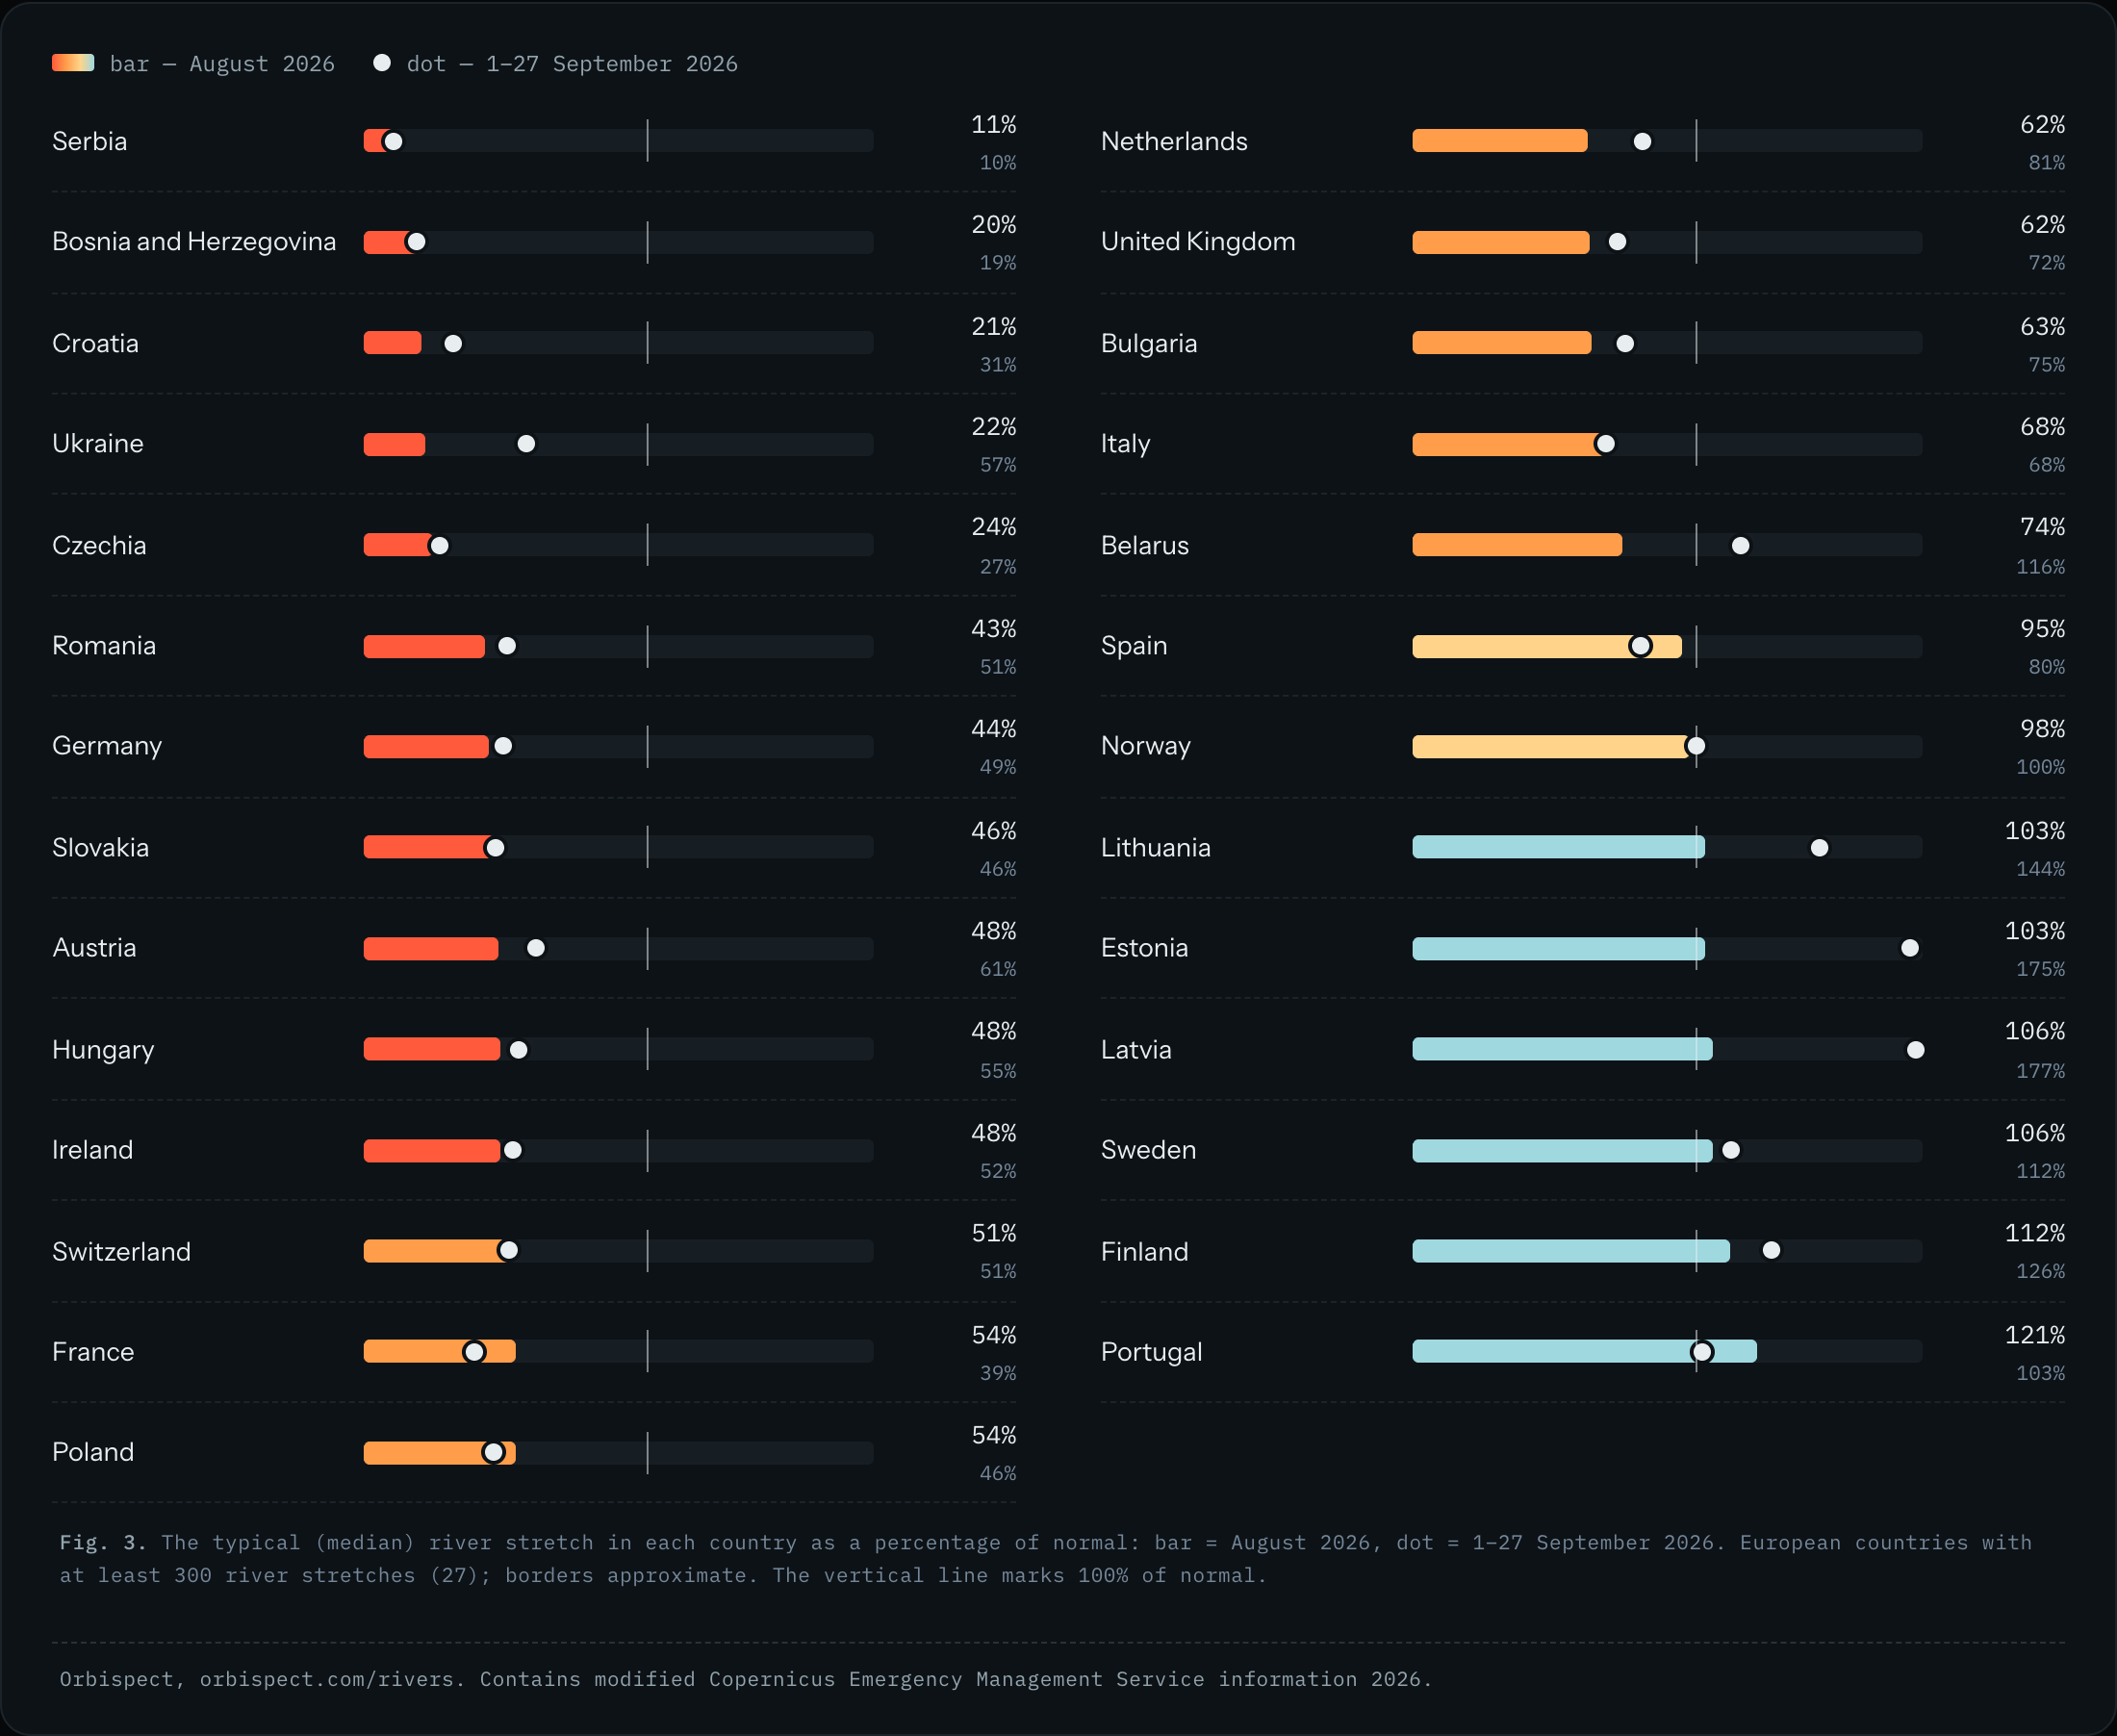
Country medians show a belt of water shortage stretching from the Balkans to the British Isles. In Serbia the typical river reach had only 11% of its normal August flow, in Bosnia and Herzegovina 20%, in Croatia 21%, in Ukraine 22% and in Czechia 24% of normal. The situation was somewhat better in Romania and Germany, where flow reached 43% and 44% of normal respectively. In Austria and Hungary it was 48%, and in France and Poland 54% each.
In 9 of the 27 countries analysed, flow on every reach examined was below the August norm. This concerned among others Germany, Austria, Hungary and Serbia.
In the north of Europe the situation was better, although national medians do not show all the differences. Although in Sweden flow was 106% of normal, in the south of the country gauges showed drought, as described in the section on verifying the model. In Finland and Latvia flows exceeded the norm, reaching 112% and 106% respectively, while in Norway they were 98%. The most water relative to normal was recorded in Portugal, where flow was 121% of normal, the highest result of the 27 countries analysed.
Bar and dot. The bar shows the typical river flow in a country in August, and the dot shows the flow in September, up to the 27th day of the month. If the dot lies to the left of the bar, this means a further fall in flow; if to the right, it means an improvement. The typical reach is determined by the median, that is, the value below which half of the reaches examined lie and above which the other half lie. Clear differences between August and September can be seen in the Baltic countries and Ukraine, where flows rose considerably.
Rise in August, fall in September
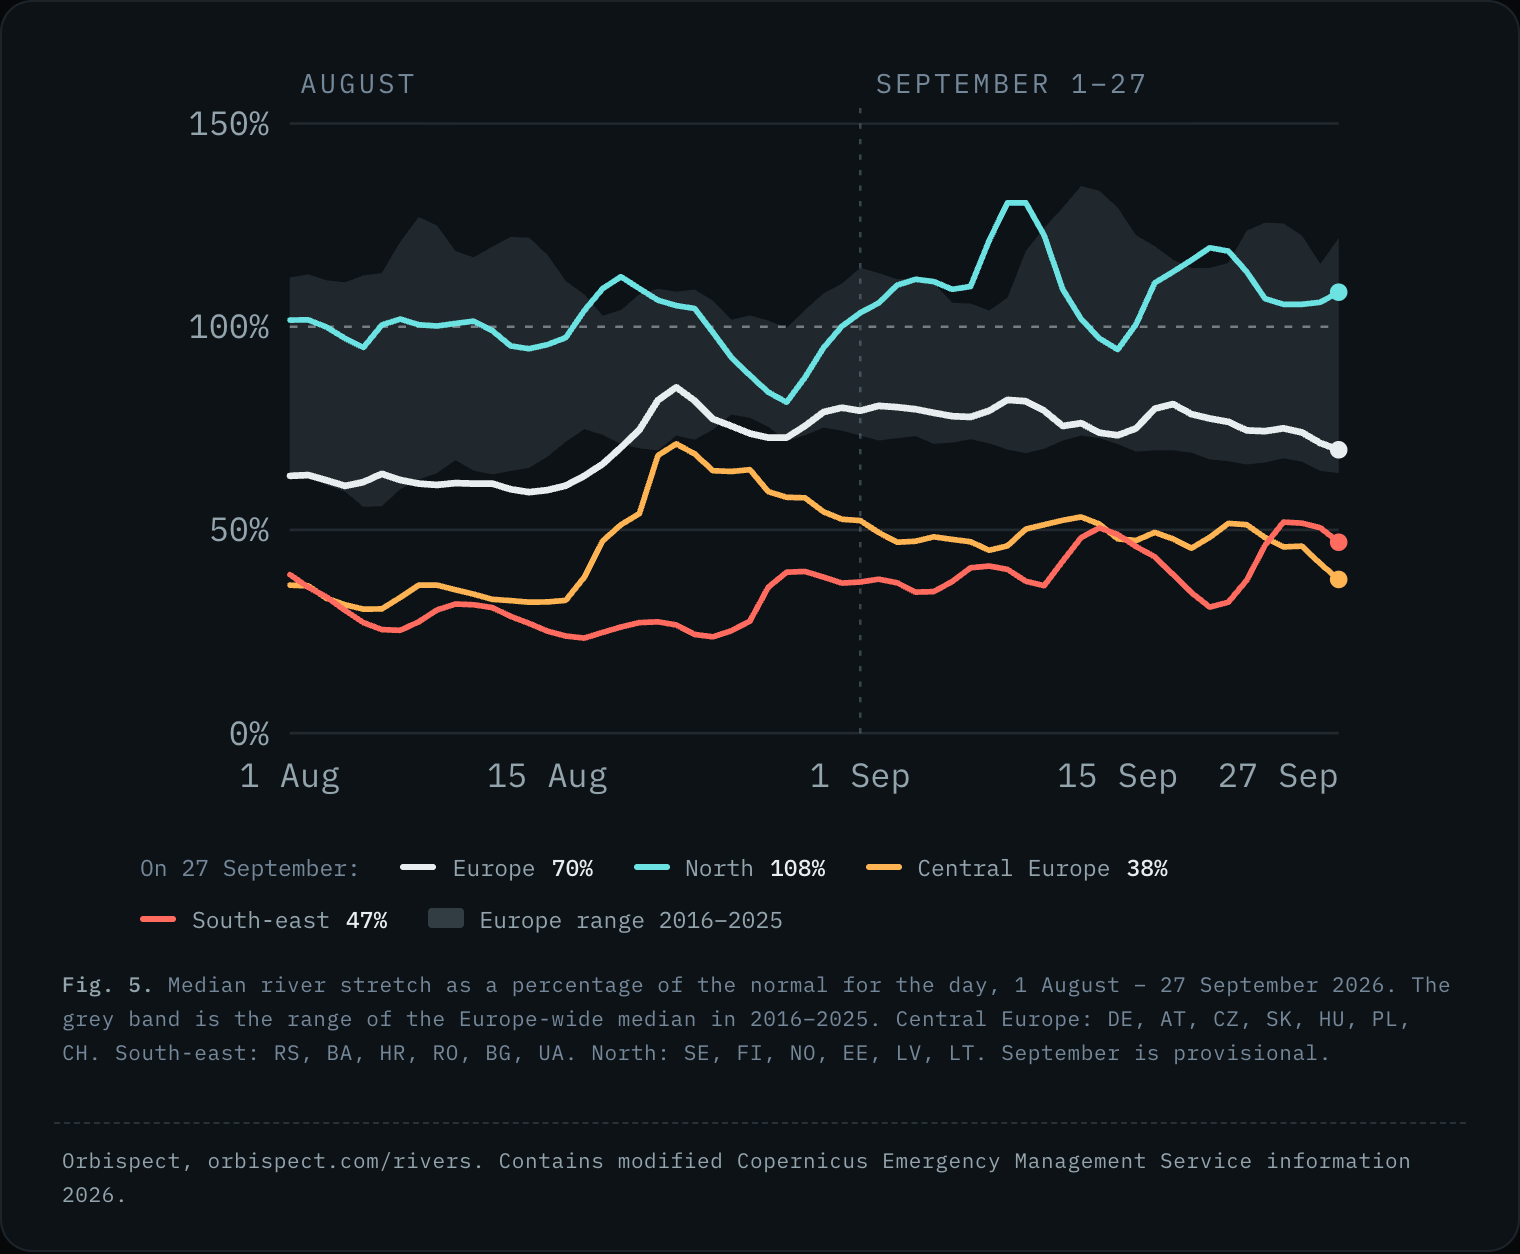
River flows changed during this period. The median for European river reaches fell to 59% of normal on 14 August and then rose to 85% around 22 August. Until the end of the month it stayed between 73% and 82%, but in September it began to fall again. On 27 September it was already 70% of normal.
The situation differed from region to region. In Central Europe (Germany, Austria, Czechia, Slovakia, Hungary, Poland and Switzerland) flows reached a minimum of 30% of normal on 5 August. They then rose to 71% on 22 August, but by 27 September fell again, this time to 38% of normal. In South-East Europe (Serbia, Bosnia, Croatia, Romania, Bulgaria and Ukraine) the lowest level (23% of normal) was recorded on 17 August. Since then flows have risen to 47%. The situation in western Europe (France, the United Kingdom, Ireland and the Netherlands) was different. On 31 August flows there were 81% of normal, but a little under four weeks later they fell to 32%, the lowest value in the series for the west.
In the north of Europe flows throughout the period analysed stayed at at least about 80% of normal. For example, the typical river in Latvia in September reached 177% of normal, in Finland 126% and in Sweden 112%.
For the countries covered by the analysis, the median flow for the period 1-27 September 2026 was 78% of normal. This is the same as in September 2018, which until now was the driest September in the period analysed since 2016. The results of the two years differ by less than 0.1 percentage points, so they are considered a tie. (Data for 2026 cover the period up to 27 September.)
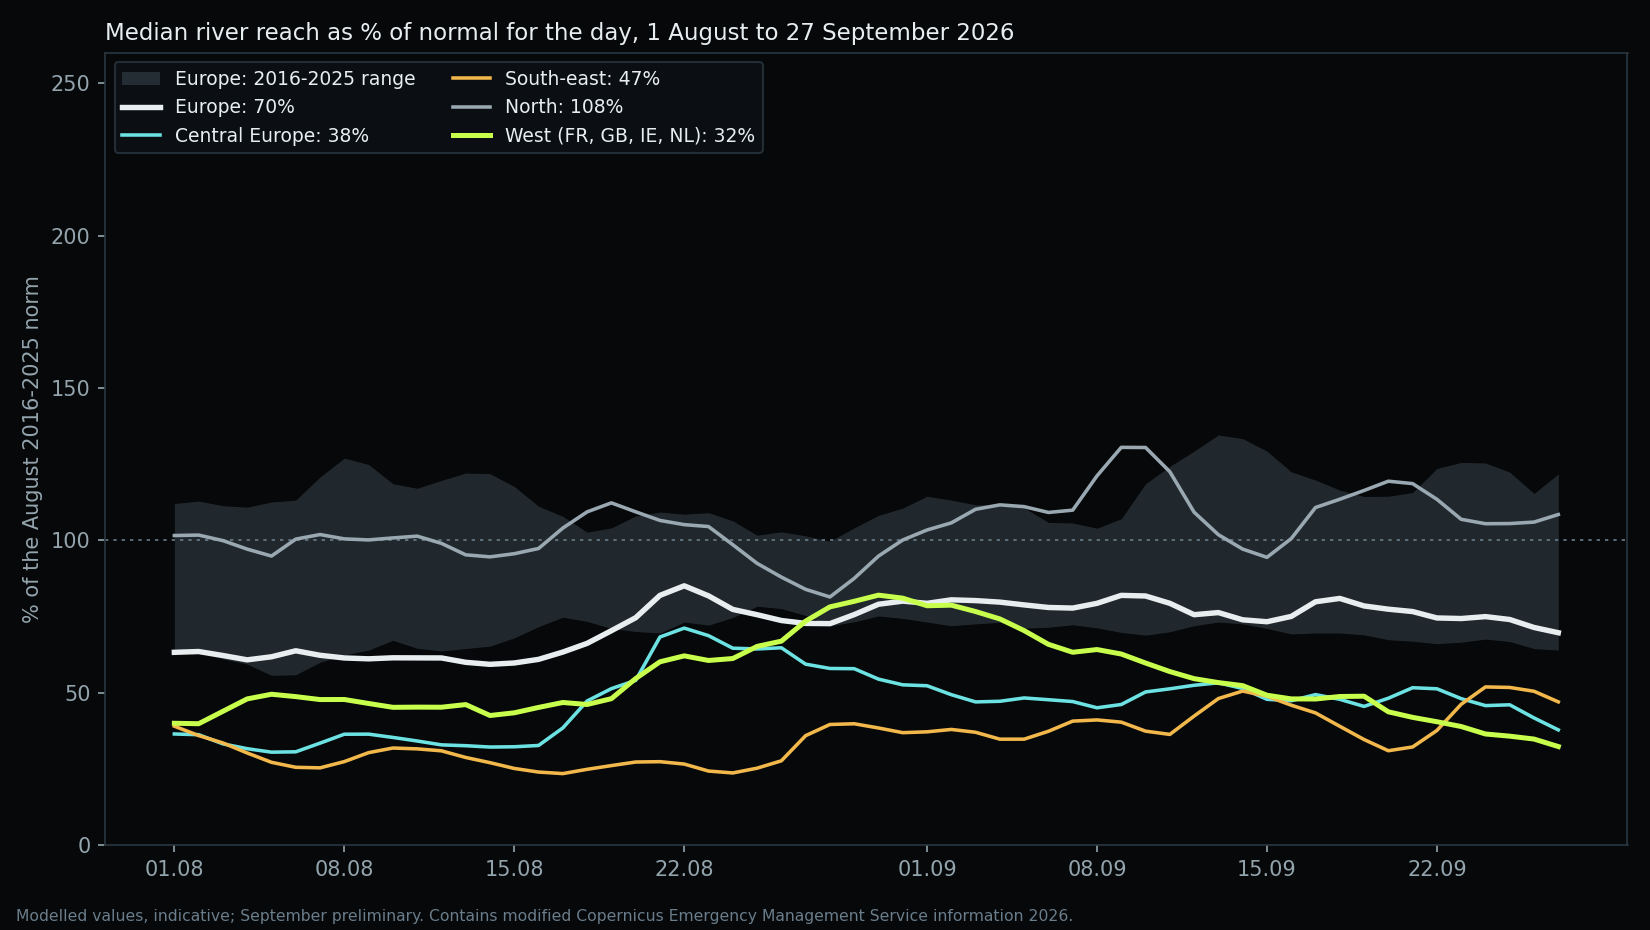
Flow lines. The chart shows changes in the typical river flow from day to day, from 1 August to 27 September. The grey band shows the range of medians for the whole of Europe in 2016-2025. If the line lies below this band, it means that flow was lower than the median in each of those years. The lines for individual regions show how differently the drought developed in Europe. The median for the countries covered by the analysis fell to 59% of normal on 14 August, then rose to 85% around 22 August, and on 27 September it was 70%. Click a region's name in the legend to hide or show its line.
Numbers for every country
Table 1 presents data for 27 countries in which at least 300 river reaches were analysed. It contains the median flow in August 2026 as a percentage of the 2016-2025 and 1991-2020 norms, the share of reaches on which flow fell below half of the 1991-2020 norm, and the share of reaches on which it was the driest August since 1991.
| Country | % of 2016-2025 norm | % of 1991-2020 norm | Reaches below half of normal | Lowest August since 1991 | Region |
|---|---|---|---|---|---|
| Austria | 48% | 51% | 47% | 43% | Central Europe |
| Belarus | 74% | 80% | 35% | 0% | Other |
| Bosnia and Herzegovina | 20% | 18% | 93% | 84% | South-east |
| Bulgaria | 63% | 54% | 47% | 16% | South-east |
| Croatia | 21% | 19% | 95% | 52% | South-east |
| Czechia | 24% | 23% | 81% | 20% | Central Europe |
| Estonia | 103% | 105% | 0% | 0% | North |
| Finland | 112% | 127% | 0% | 0% | North |
| France | 54% | 43% | 58% | 23% | West |
| Germany | 44% | 40% | 79% | 22% | Central Europe |
| Hungary | 48% | 49% | 56% | 69% | Central Europe |
| Ireland | 48% | 44% | 67% | 1% | West |
| Italy | 68% | 72% | 9% | 2% | Other |
| Latvia | 106% | 139% | 0% | 0% | North |
| Lithuania | 103% | 122% | 0% | 0% | North |
| Netherlands | 62% | 56% | 35% | 20% | West |
| Norway | 98% | 116% | 0% | 0% | North |
| Poland | 54% | 51% | 48% | 4% | Central Europe |
| Portugal | 121% | 116% | 0% | 0% | Iberia |
| Romania | 43% | 28% | 78% | 46% | South-east |
| Serbia | 11% | 11% | 100% | 54% | South-east |
| Slovakia | 46% | 46% | 72% | 47% | Central Europe |
| Spain | 95% | 92% | 18% | 2% | Iberia |
| Sweden | 106% | 113% | 15% | 8% | North |
| Switzerland | 51% | 50% | 50% | 30% | Central Europe |
| Ukraine | 22% | 16% | 98% | 27% | South-east |
| United Kingdom | 62% | 63% | 35% | 9% | West |
23 rivers of Europe under the lens
The list covers the 23 largest rivers of Europe, each represented by one measurement point, usually in the lower course. For 13 of them August 2026 was the driest since 2016. The table can be sorted and filtered. After the section on Poland, two examples based on gauge readings are presented: the Rhine at Kaub and the Danube at Budapest.
| River | Section | August 2026, % of normal | September 1-27, % of normal | Rank of 11 (1 = driest) | m³/s: August / normal |
|---|---|---|---|---|---|
| Sava | Sremska Mitrovica | 20% | 35% | 1 | 146 / 714 |
| Dniester | Bender | 25% | 22% | 1 | 42 / 171 |
| Tisza | Szeged | 25% | 24% | 1 | 113 / 448 |
| Loire | Montjean | 28% | 39% | 1 | 50 / 175 |
| Mureș | Arad | 29% | 27% | 1 | 31 / 108 |
| Weser | Intschede | 38% | 56% | 2 | 63 / 167 |
| Drava | Osijek | 38% | 49% | 1 | 166 / 442 |
| Rhine | Lobith | 42% | 52% | 1 | 743 / 1,767 |
| Elbe | Neu Darchau | 42% | 50% | 2 | 194 / 461 |
| Vistula | Włocławek | 44% | 29% | 1 | 245 / 561 |
| Danube | Budapest | 48% | 55% | 1 | 1,313 / 2,727 |
| Shannon | Limerick | 58% | 54% | 3 | 61 / 105 |
| Oder | Hohensaaten | 60% | 56% | 3 | 258 / 435 |
| Rhône | Beaucaire | 65% | 59% | 1 | 759 / 1,162 |
| Seine | Poses | 66% | 59% | 2 | 165 / 251 |
| Garonne | Tonneins | 66% | 27% | 6 | 83 / 126 |
| Po | Pontelagoscuro | 68% | 77% | 1 | 726 / 1,071 |
| Glomma | Sarpsborg | 72% | 82% | 1 | 643 / 896 |
| Ebro | Tortosa | 83% | 76% | 1 | 113 / 136 |
| Daugava | Salaspils | 88% | 165% | 7 | 447 / 506 |
| Tagus | Almourol | 105% | 96% | 11 | 140 / 134 |
| Douro | Régua | 122% | 103% | 11 | 248 / 204 |
| Kemijoki | Rovaniemi | 133% | 134% | 10 | 856 / 645 |
Drought in Poland: rivers against the data
According to the model, in August 2026 the typical river reach in Poland had a flow of 54% of the 2016-2025 norm and 51% of the 1991-2020 norm. The Vistula was among the rivers with the lowest August flow in the series since 2016[15]. On 48% of the reaches analysed flow fell below half of the 1991-2020 norm. Below are model results for eleven points on the Vistula, Oder, Bug, Warta, Noteć and Narew.
Data from national gauges were not included, because their use in business activity may require an agreement with the institute that provides them. All values in this section come from the model, so they are estimates, not direct readings.
What this means in Poland
As of 3 September 2026 IMGW had issued 91 warnings of hydrological drought, of which more than half concerned the Vistula basin and 35 the Oder basin.[12] At Warsaw-Bulwary the Vistula level fell to 98 cm, below the previous lowest reading of 100 cm, and Polsat News described it as record low.[12] The portal Energetyka24 linked limited cooling-water intake to the low flow of the Vistula, and on 4 August 2026 Enea Wytwarzanie reported six units unavailable at Kozienice and Połaniec with a combined capacity of about 1.3 GW.[13] IMGW data come from gauge measurements, while the values 54% and 51% come from the Copernicus model, so they cannot be compared directly.
| River and section | Vistula, Sandomierz | Bug, Wyszków | Vistula, Warszawa | Oder, Racibórz-Miedonia | Vistula, Tczew | Oder, Nowa Sól | Oder, Ścinawa | Oder, Gozdowice | Noteć, Drezdenko | Warta, Poznań | Narew, Ostrołęka |
|---|---|---|---|---|---|---|---|---|---|---|---|
| August 2026, model (% of 2016-2025 norm) | 31% | 34% | 34% | 47% | 49% | 52% | 52% | 60% | 63% | 83% | 97% |
Rhine at Kaub: below the old record
−6 cm: gauge reading early on 1 October; the former record low was 25 cm (2018).
Early on 1 October the gauge reading was −6 cm. The previous minimum was 25 cm and was recorded in 2018.[7] These are raw, unverified data. According to press reports, however, the gauge showed a dozen or so centimetres already in mid-August 2026, so the former record was passed earlier than 1 October. On the evening of 30 September the gauge showed −4 cm, and on the morning of 1 October already −6 cm. Over the course of September the flow of the river at this point fell to about 420 m³/s on 1 October.
According to the model, in August the flow of the Rhine at Lobith, in the Netherlands about 400 km from Kaub, was 42% of normal. The effects of low water on shipping are described in the section on the causes of the drought.
The Danube at Budapest: driest August since 2016
48%: of the August normal in the model, the driest August since 2016.
According to press reports, on 29 July the gauge at Budapest showed 23 cm, less than the previous minimum of 33 cm, recorded in October 2018[8]. In August the average flow of the Danube at this point was 1,313 m³/s, corresponding to 48% of normal.
Near Novi Sad hundreds of boats and dozens of cargo ships were stranded because of the low water level[8].
Drought from orbit: how the Rhine and the Po changed
Satellite images show changes that cannot be seen in tables. Below are the Rhine and the Po, for which August 2026 was, according to the model, the driest since 2016, and the Alps. Each pair of images of the Rhine and the Po shows the same area of about 8 × 5 km, in a year when flow was close to normal and in mid-August 2026. The images of the Alps come from August 1990 and 2026 and cover an area of about 24 × 15 km. A narrower channel and exposed, light-coloured patches of riverbed or sandbars indicate lower water levels. The images alone, however, do not allow the size of the flow to be determined.
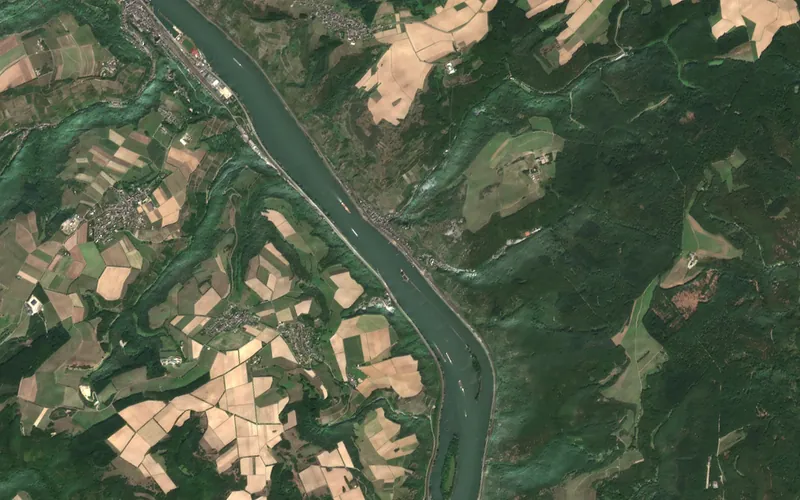 23 August 2019
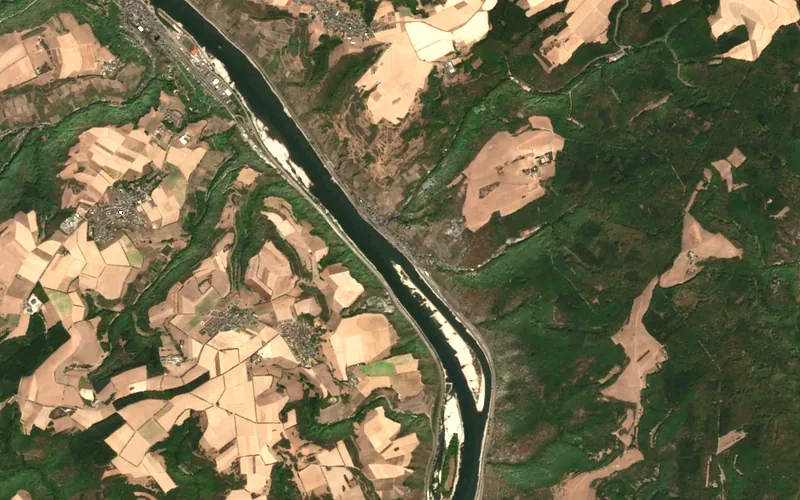 14 August 2026
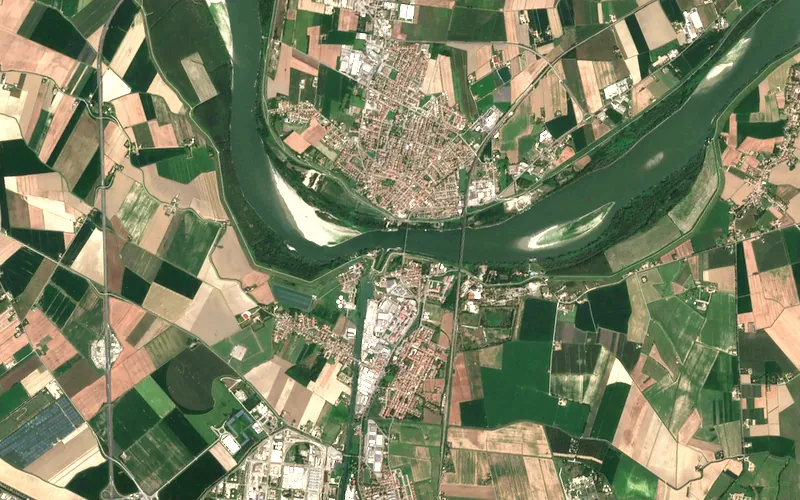 16 August 2023
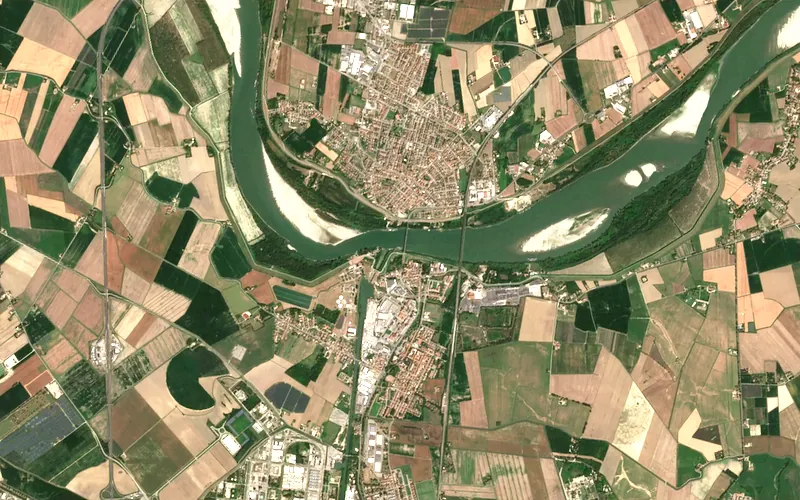 15 August 2026
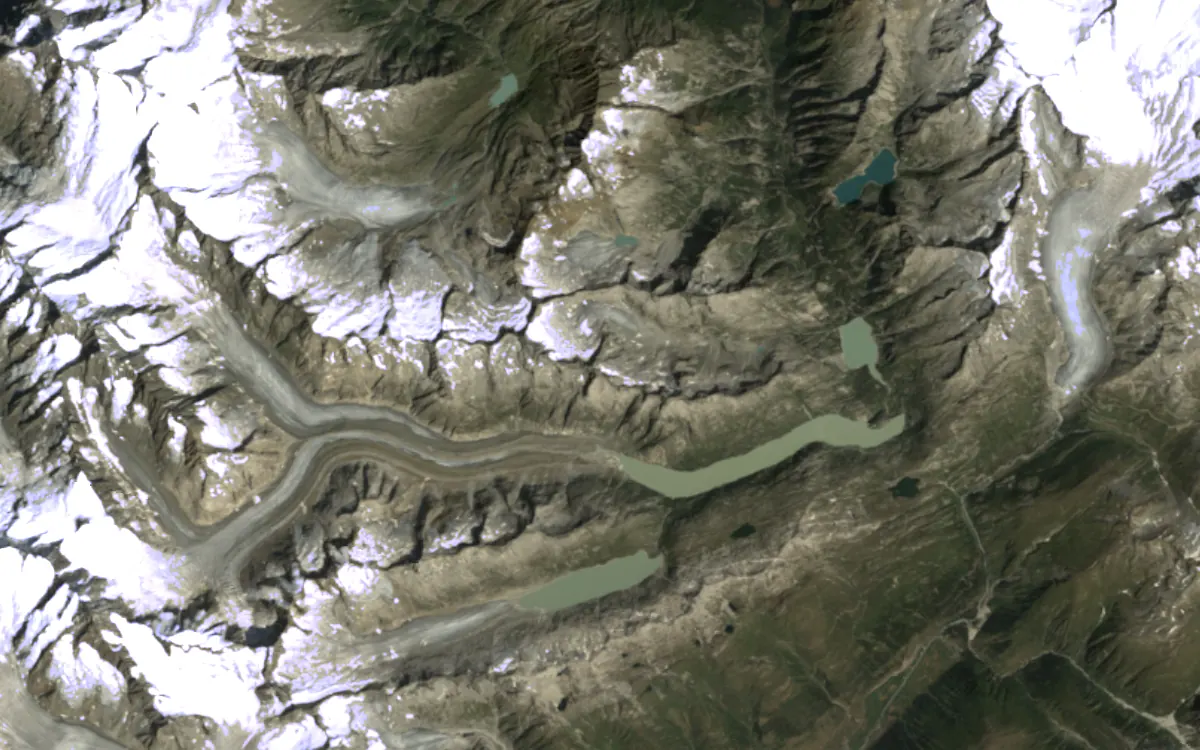 9 August 1990
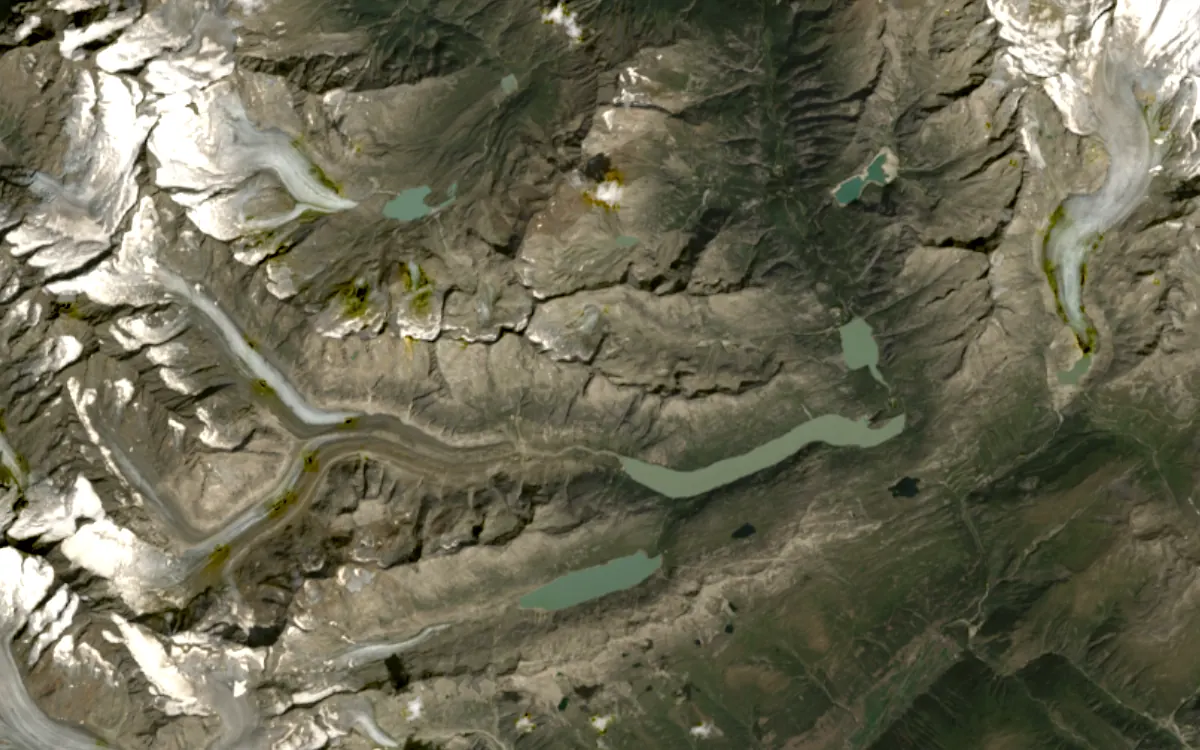 13 August 2026
What else can be measured from orbit
The report is based on a river flow model that takes observed weather conditions into account. Satellites, however, can also measure other phenomena related to drought and its effects: land and water surface temperature, soil moisture by radar, water levels in reservoirs and lakes, the state of vegetation and snow cover in the mountains.
This edition uses satellite images from before and during the drought, as well as data on temperature and soil moisture from the climate reanalysis. This makes it possible to show not only low river flow but also changes in their surroundings, such as exposed riverbeds and banks, drying soil or the effects of heat. The comparison of images is a first step towards wider use of satellite observations in drought analysis.
What next: when will rivers return to normal?
After such a dry summer rivers usually do not return to normal after the first rain. Soil and groundwater are heavily dried out, so even typical autumn rainfall may first replenish these deficits before water reaches river channels. A return to normal flows may therefore take months, not weeks.
The amount of water stored underground, which feeds rivers in periods without rain, is very important. Soil moisture can recover within a few weeks, and river flows over a whole season. Water that seeps deep through rock and reaches deep underground reservoirs may need as much as many years for this.
Additional analyses and data (information for readers)
The following sections contain much more detailed analyses, including comparisons with different norms, changes in flows over time, data for river basins and an assessment of the model's agreement with measurements. They can be skipped without losing the most important conclusions of the report.
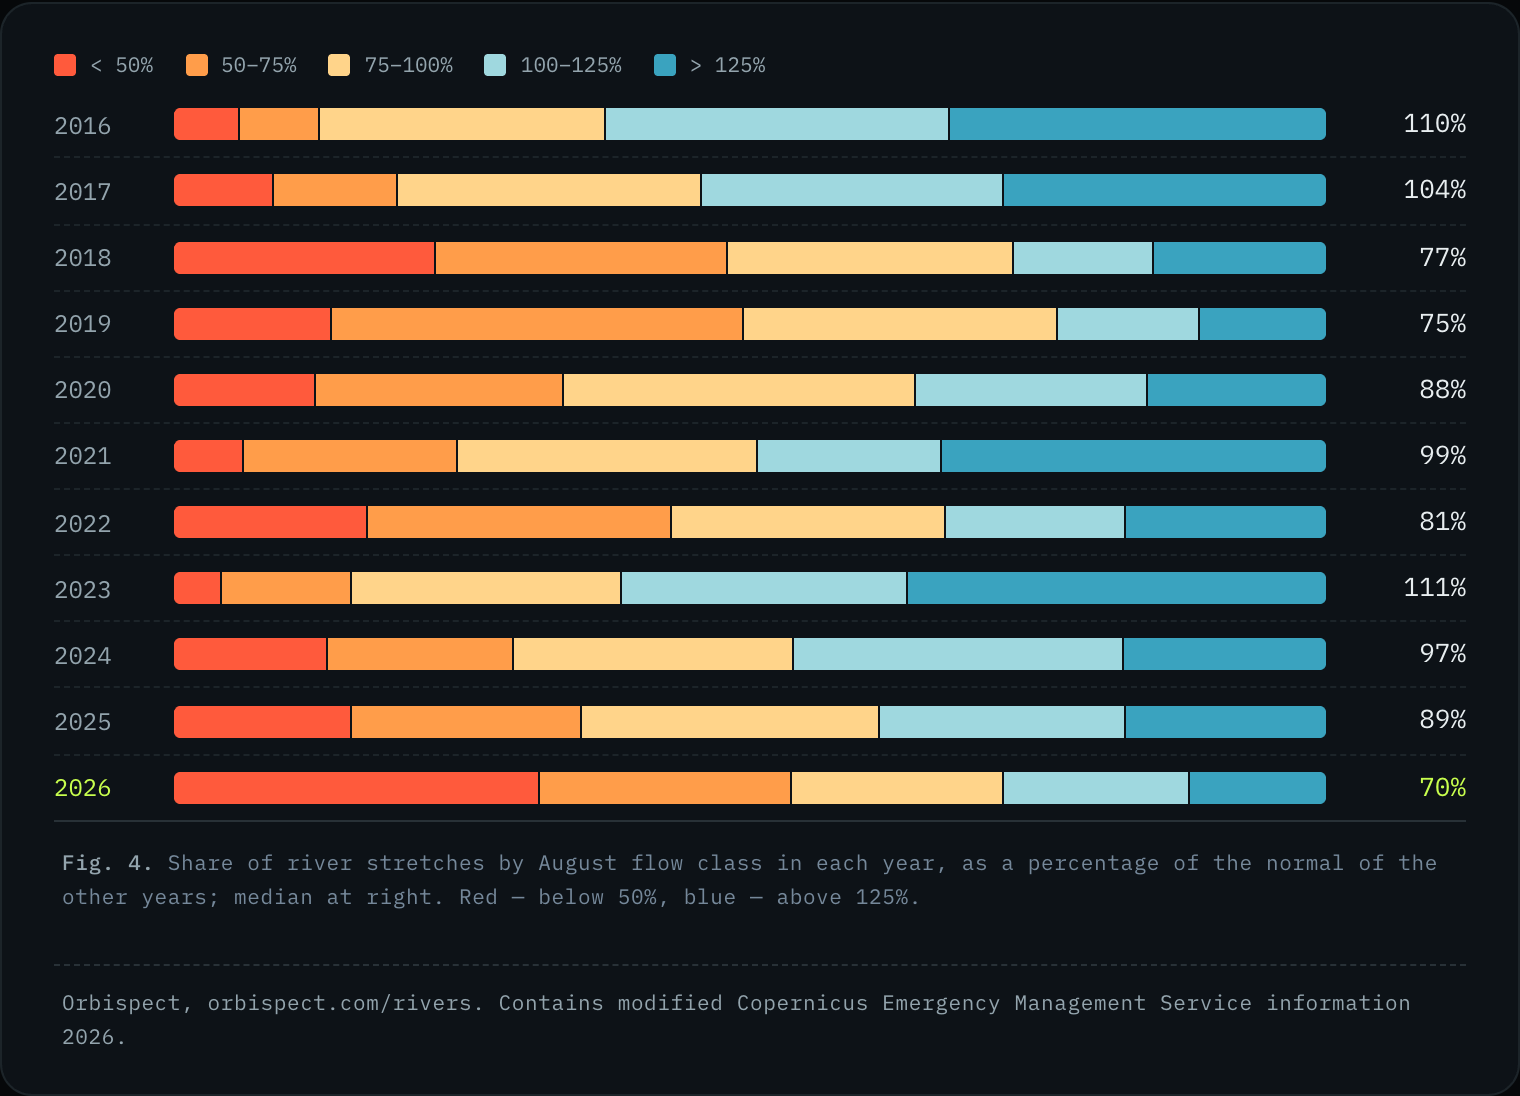
August against the decade
Against the ten previous Augusts from 2016-2025, August 2026 was the lowest. Flow on the typical river reach was 70% of normal, compared with 75% in 2019, 77% in 2018 and 81% in 2022. In 2026 the largest share of reaches on which flow fell below half of normal was also recorded: it was 32%, against 23% in 2018.
For 27% of river reaches August 2026 was the driest since 2016, and for 40% one of the two driest. Only 6% of reaches recorded their highest August flow in the whole period analysed.
“Normal” here means the average flow in August over the last decade. This is a relatively short period that includes three wet Augusts (2016, 2017 and 2023).
Colour bands. Each row shows one August. The coloured bands show what share of river reaches had very little water (red means flow below half of normal) and what share very much (blue). The wider the red band, the greater the extent of the drought. The median, that is the flow of the typical river reach, is given on the right. The wettest were the Augusts of 2016 (110%) and 2023 (111%). They raise the average for the decade analysed, which makes the situation in 2026 look even worse against them.
Against the long term: August 2026 in historical perspective (1991-2020)
The main comparison in the report is based on the 2016-2025 norm. For broader context the 1991-2020 norm was also included. In this comparison the flow on the typical river reach in August 2026 was 72% of normal. This was the third lowest result since 1991, with lower values recorded only in August 2003 (62%) and 1994 (65%).
The share of river reaches on which flow fell below half of normal is a record. In August 2026 this concerned 35% of reaches, against only 31% in 2003 and 28% in 1994. At the same time, on 14% of reaches August 2026 was the driest since 1991. Of the 23 large rivers analysed, on nine no lower August flow had been recorded since 1991. Among them were the Rhine at Lobith, the Danube at Budapest, the Rhône, the Loire, the Sava and the Tisza.
This means that the drought of 2026 covered an exceptionally large number of reaches with very low flow, but was not the deepest in the whole period analysed.
All values given come from the model.
Chart of western Europe. The chart shows changes in river flow in western Europe against the whole continent. In western Europe flow was 81% of normal on 31 August, but a little under four weeks later the water shortage deepened quickly and flow fell to 32%.
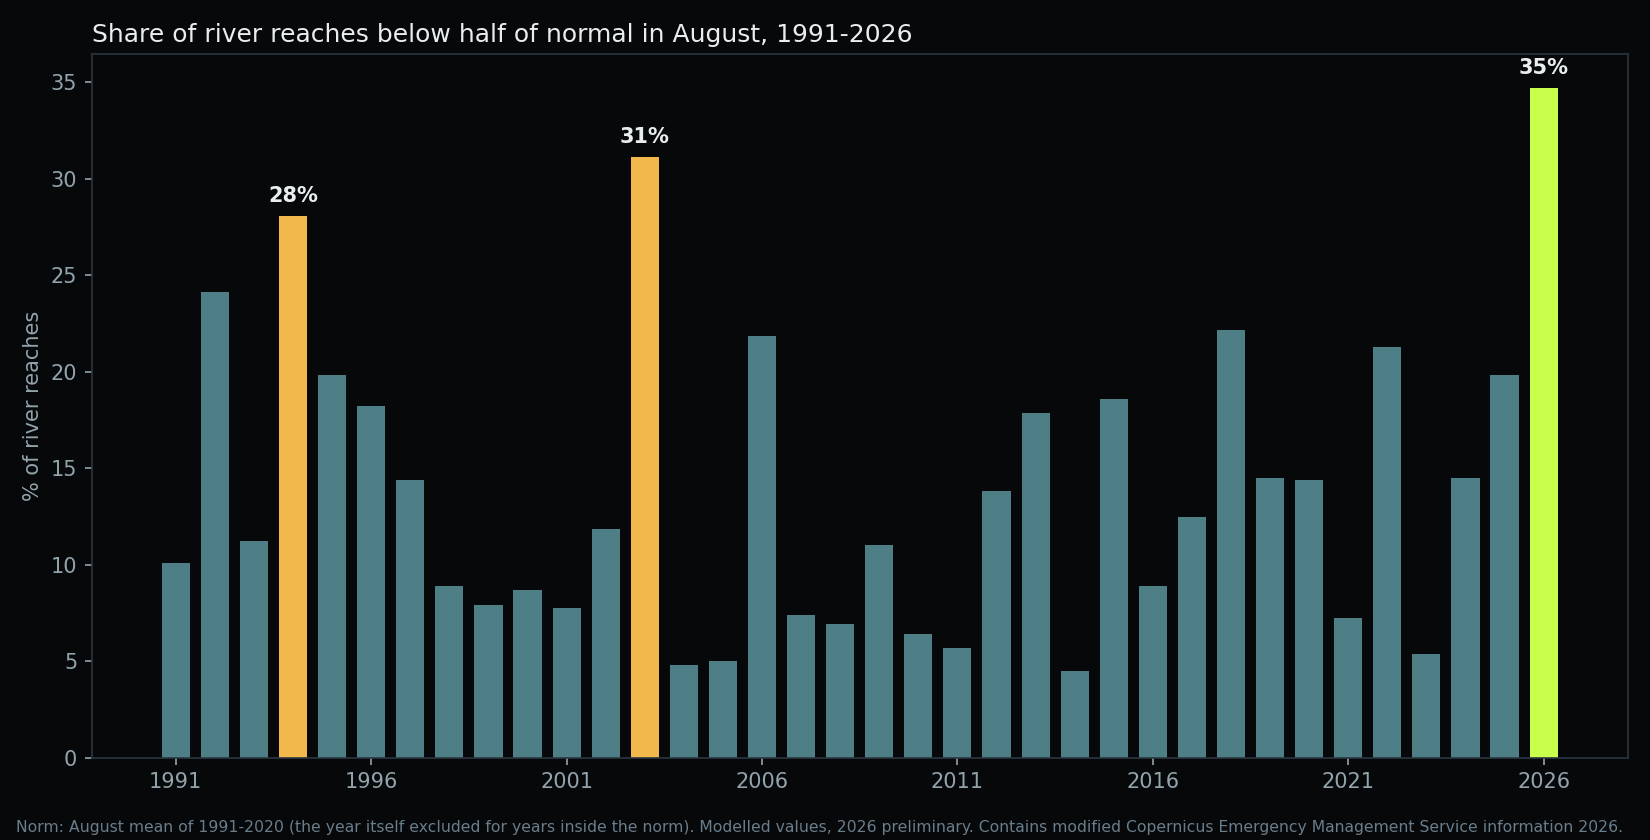
Chart since 1991. Each bar shows one August since 1991, and its height shows the share of river reaches on which flow fell below half of normal. The highest bar, on the right of the chart, corresponds to 2026. The chart shows that the drought of 2026 covered a larger area than in 2003 and 1994, although in those years the flow on the typical river reach was lower. This means that the drought of 2026 had the greatest extent but not the greatest depth, if judged by the median flow.
From winter to summer: how the drought built up in 2026
The drought did not begin in August. In January flow on the typical river reach was 90% of normal, and in February and March it was higher than usual. In the period from April to June flow ranged between 67% and 77% of normal, while in July on 39% of river reaches flow fell below half of normal. This was the highest share recorded in the model for July since 1991. In August it was 35%, also setting a record for that month.
On the basis of the 36-year model record and the 1991-2020 norm, each month was compared with the same month in 1991-2026. All values come from the model.
| Month, 2026 | Typical stretch, % of 1991-2020 norm | Rank of 36 (1 = driest) | Stretches below half of normal | Rank of 36 (1 = most) | Lowest flow since 1991 |
|---|---|---|---|---|---|
| January | 90% | 11 | 19% | 8 | 4% |
| February | 106% | 30 | 11% | 17 | 3% |
| March | 115% | 35 | 7% | 27 | 1% |
| April | 77% | 6 | 30% | 5 | 5% |
| May | 67% | 2 | 26% | 2 | 12% |
| June | 73% | 4 | 23% | 3 | 9% |
| July | 64% | 3 | 39% | 1 | 16% |
| August | 72% | 3 | 35% | 1 | 14% |
September improvement does not end the drought
Unfortunately the improvement does not mean a return to normal. From August to the first 27 days of September the median flow rose by more than 10 percentage points in 11 countries, most in Latvia, Estonia and Belarus. In three countries the median fell by more than 10 percentage points: Portugal, Spain and France.
Despite the improvement, in September in 20 of the 27 countries the typical river reach still had a flow below the 2016-2025 norm. The results should be treated as indicative, because the September data cover only the first 27 days of the month.
| Country | August (% of norm) | 1-27 September (% of norm) | Change (pp; from unrounded values) | Region |
|---|---|---|---|---|
| Latvia | 106% | 177% | +71.8 | North |
| Estonia | 103% | 175% | +71.8 | North |
| Belarus | 74% | 116% | +41.5 | Other |
| Lithuania | 103% | 144% | +40.5 | North |
| Ukraine | 22% | 57% | +35.4 | South-east |
| Netherlands | 62% | 81% | +18.9 | West |
| Finland | 112% | 126% | +13.8 | North |
| Austria | 48% | 61% | +12.7 | Central Europe |
| Bulgaria | 63% | 75% | +11.6 | South-east |
| Croatia | 21% | 31% | +10.8 | South-east |
| United Kingdom | 62% | 72% | +10.2 | West |
| Romania | 43% | 51% | +7.7 | South-east |
| Hungary | 48% | 55% | +6.6 | Central Europe |
| Sweden | 106% | 112% | +6.2 | North |
| Germany | 44% | 49% | +5.2 | Central Europe |
| Ireland | 48% | 52% | +4.1 | West |
| Czechia | 24% | 27% | +2.6 | Central Europe |
| Norway | 98% | 100% | +1.9 | North |
| Italy | 68% | 68% | +0.5 | Other |
| Slovakia | 46% | 46% | +0.1 | Central Europe |
| Switzerland | 51% | 51% | 0.0 | Central Europe |
| Serbia | 11% | 10% | −0.5 | South-east |
| Bosnia and Herzegovina | 20% | 19% | −1.8 | South-east |
| Poland | 54% | 46% | −7.6 | Central Europe |
| France | 54% | 39% | −14.7 | West |
| Spain | 95% | 80% | −15.0 | Iberia |
| Portugal | 121% | 103% | −18.9 | Iberia |
A hot and dry August deepened the water shortages
Low river flow is not only the result of a lack of rain. High temperatures increase evaporation and speed up the drying of the soil.
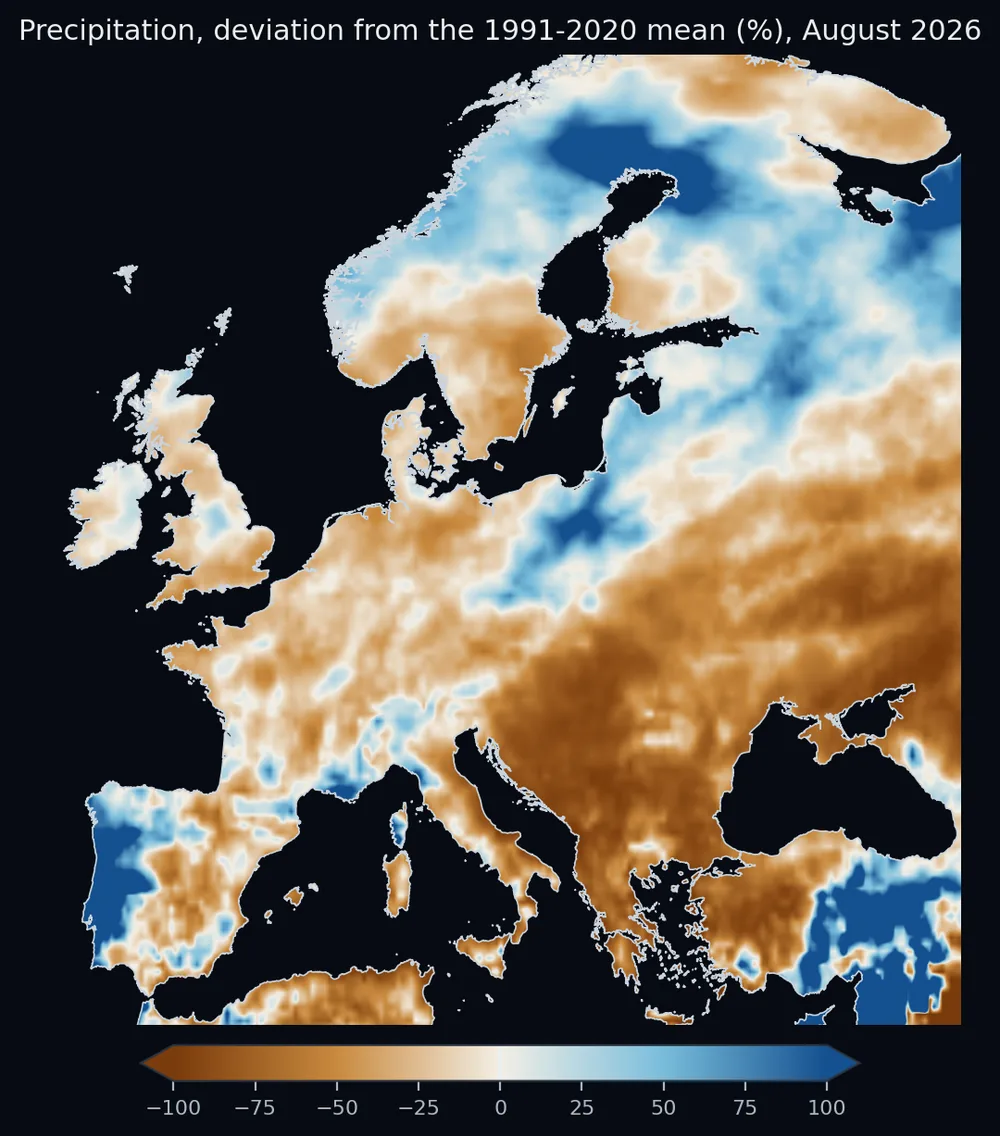
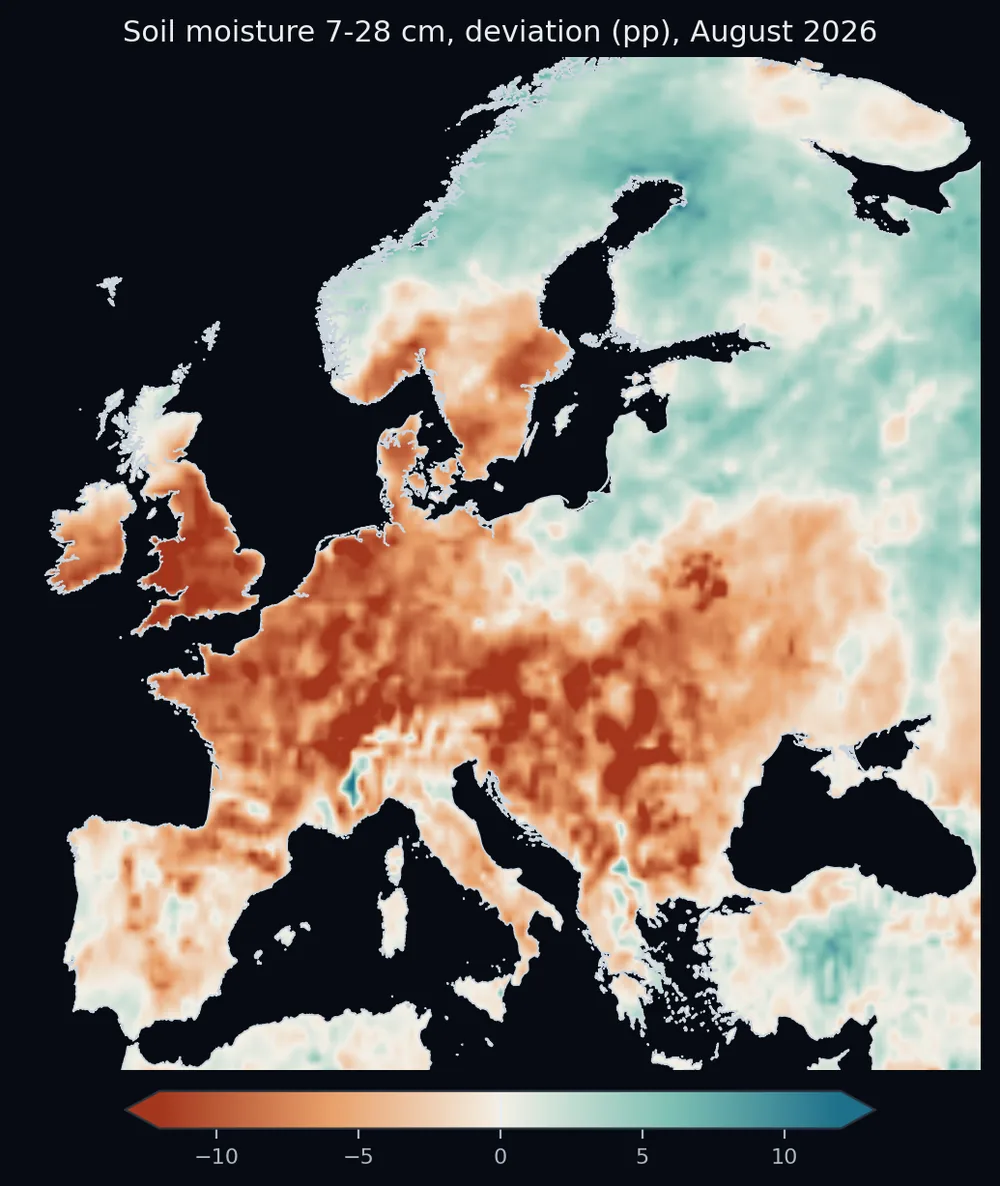
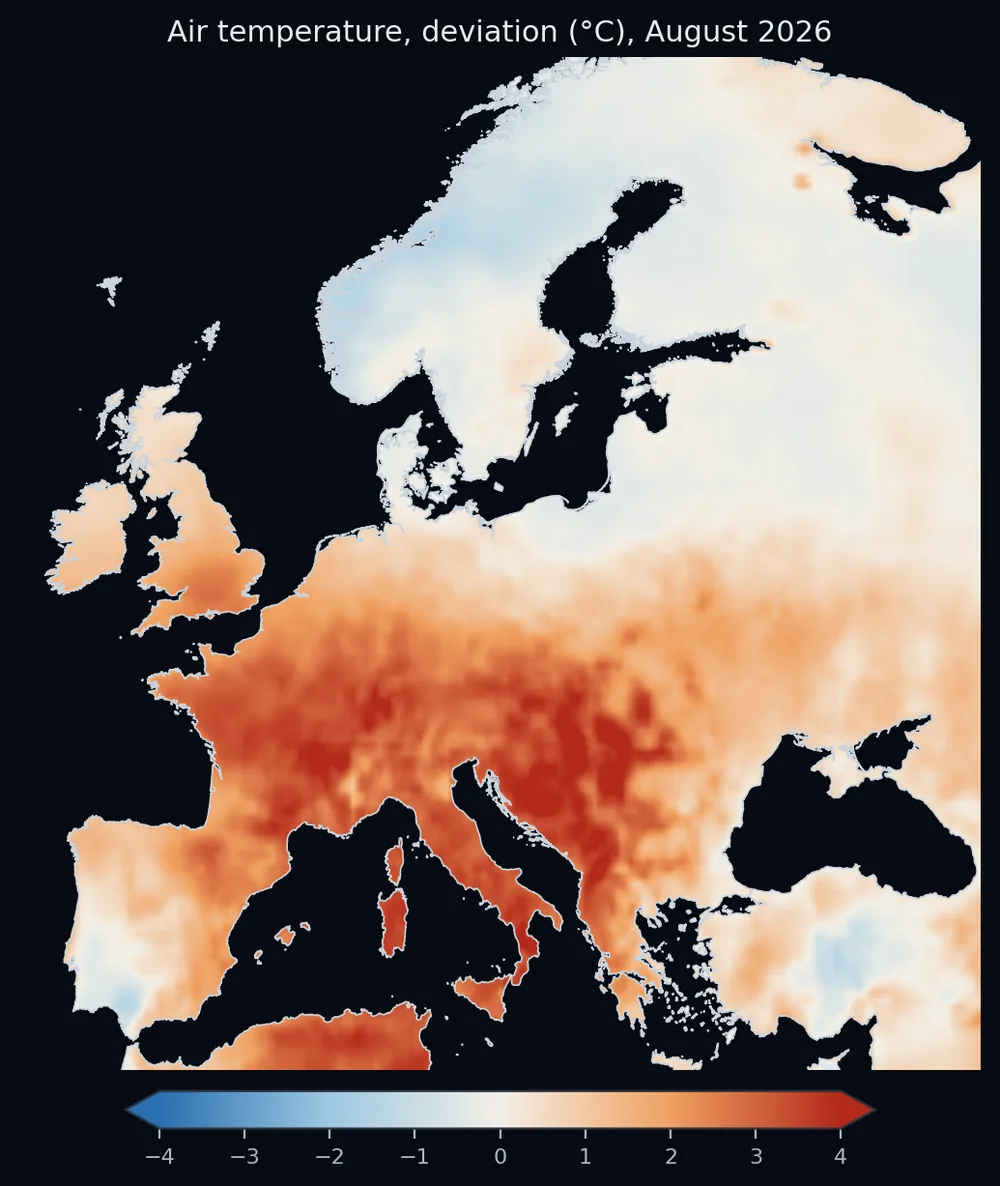
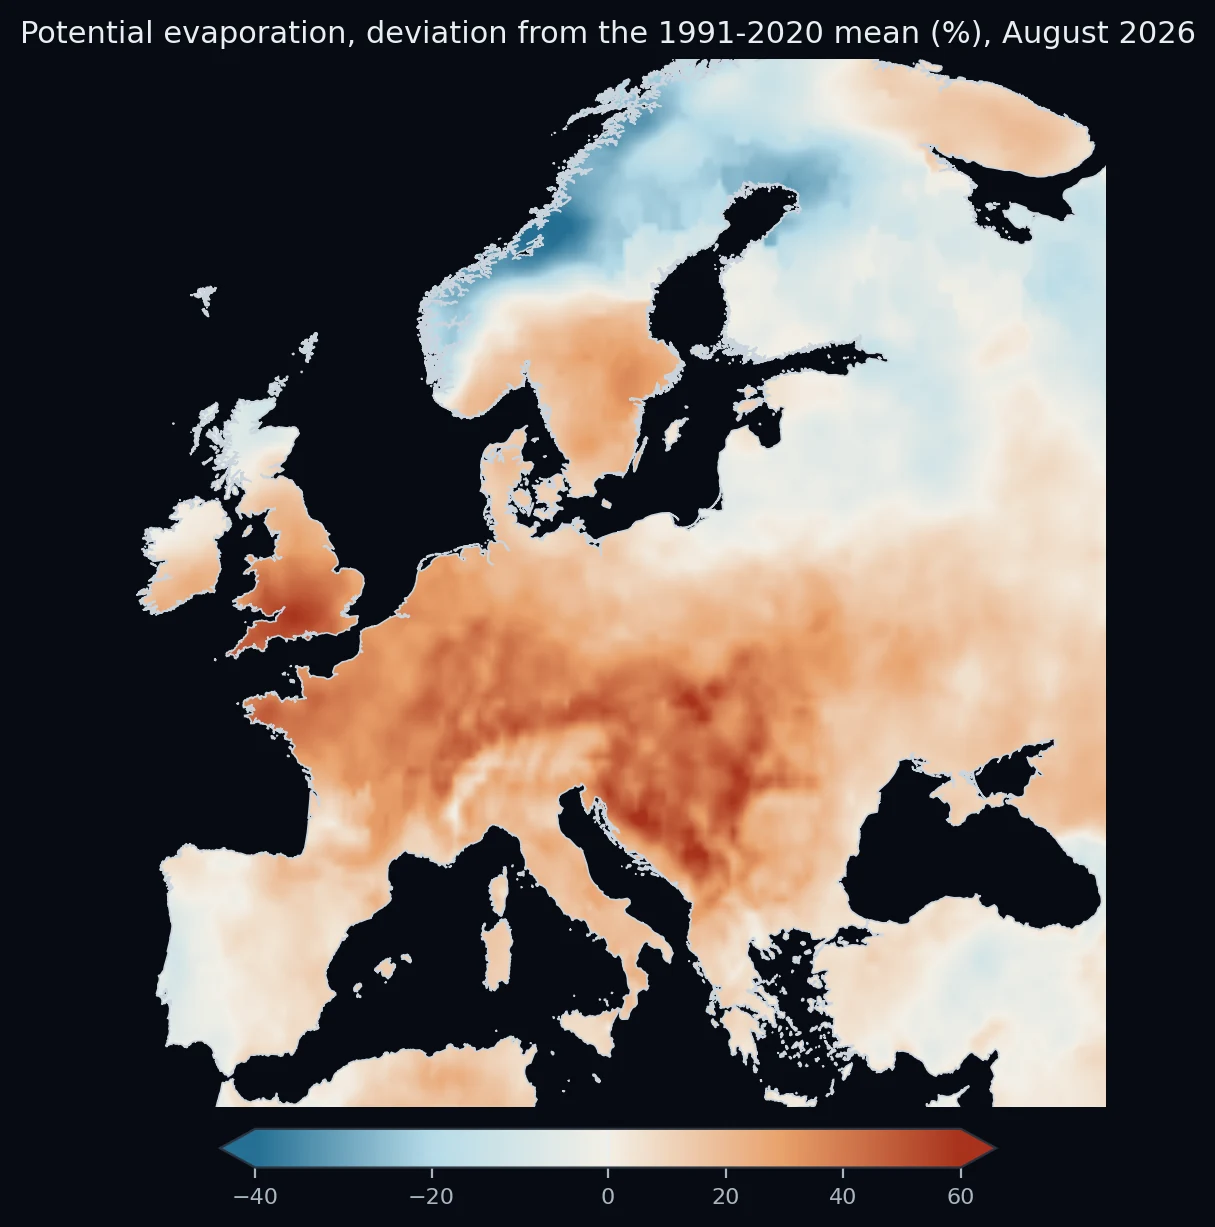
The climate reanalysis, that is a model combining observations, including satellite data, with the laws of physics describing the atmosphere, shows that August 2026 was warmer than the 1991-2020 average in 21 of the 27 countries. Rainfall was below average in 19 countries, and potential evaporation exceeded the average in 21 of the 27 countries. Runoff from the ground was below average in 25 countries, and the deeper soil layer, at a depth of 7-28 cm, was drier than usual in 20 countries.
The least rainfall relative to the average was recorded in Serbia (10%), Bosnia and Herzegovina (12%) and Croatia (15%). The values given are medians for river reaches in individual countries, not measurements from single stations.
The table does not prove that heat or lack of rain caused the low river flow. It only shows that these phenomena occurred in the same month. Rivers respond to changes in weather with a delay, which is why, for example, in Poland river flow was low even though rainfall was above average.
Assessment of vegetation and albedo, that is the ability of a surface to reflect solar radiation, should be based on satellite images. In the reanalysis these values largely result from climatological data, so they are not suitable for assessing conditions in August 2026.
Four maps show how August 2026 differed from the average in terms of rainfall, soil moisture, temperature and evaporation. The maps show similar belts of drought and low river flow.
| Country | Air temperature, deviation from 1991-2020 (°C) | Precipitation (% of norm) | Potential evaporation (% of norm) | Runoff from land (% of norm) | Soil 0-7 cm (pp) | Soil 7-28 cm (pp) | Region |
|---|---|---|---|---|---|---|---|
| Serbia | +3.4 | 10% | 140% | 31% | −8.4 | −6.5 | South-east |
| Bosnia and Herzegovina | +3.9 | 12% | 149% | 34% | −10.0 | −7.3 | South-east |
| Croatia | +3.6 | 15% | 143% | 42% | −9.2 | −7.3 | South-east |
| Hungary | +3.6 | 15% | 141% | 8% | −8.8 | −9.4 | Central Europe |
| Bulgaria | +1.8 | 16% | 121% | 15% | −7.8 | −7.1 | South-east |
| Romania | +1.9 | 39% | 125% | 12% | −7.6 | −7.2 | South-east |
| Slovakia | +2.7 | 39% | 141% | 17% | −8.2 | −8.4 | Central Europe |
| Ukraine | +1.3 | 40% | 118% | 27% | −5.0 | −4.3 | South-east |
| Netherlands | +1.3 | 74% | 132% | 46% | −7.3 | −9.7 | West |
| Austria | +3.0 | 75% | 136% | 22% | −5.6 | −7.4 | Central Europe |
| Germany | +1.9 | 76% | 133% | 40% | −6.7 | −8.5 | Central Europe |
| Switzerland | +3.3 | 79% | 130% | 28% | −6.9 | −10.0 | Central Europe |
| France | +3.1 | 79% | 134% | 55% | −5.4 | −8.3 | West |
| United Kingdom | +0.8 | 84% | 117% | 57% | −3.8 | −5.7 | West |
| Belarus | +0.2 | 85% | 106% | 59% | −2.3 | −2.0 | Other |
| Czechia | +2.1 | 89% | 133% | 21% | −5.6 | −7.5 | Central Europe |
| Ireland | +1.0 | 94% | 111% | 65% | −5.4 | −7.3 | West |
| Italy | +2.8 | 95% | 120% | 62% | −2.3 | −2.2 | Other |
| Spain | +1.4 | 100% | 105% | 64% | −0.6 | −2.0 | Iberia |
| Norway | −0.7 | 101% | 86% | 105% | +2.2 | +2.1 | North |
| Estonia | 0.0 | 105% | 100% | 73% | +1.5 | +2.4 | North |
| Lithuania | −0.2 | 108% | 98% | 83% | +2.2 | +2.4 | North |
| Poland | +0.6 | 114% | 116% | 32% | −1.5 | −1.5 | Central Europe |
| Finland | −0.2 | 121% | 92% | 96% | +3.4 | +3.8 | North |
| Sweden | −0.5 | 126% | 86% | 83% | +3.2 | +3.2 | North |
| Latvia | 0.0 | 133% | 96% | 91% | +3.0 | +3.5 | North |
| Portugal | +0.4 | 261% | 94% | 161% | +1.8 | +0.4 | Iberia |
River basins in numbers
By comparing flows in individual river basins one can see where the water shortage was greatest. In the Danube basin the typical river reach had in August a flow of 38% of normal, and on 76% of reaches the driest August since 2016 was recorded.
The Loire and Garonne basins were, in terms of the median, even drier, because flow there was about 36% of normal. However, the driest August since 2016 occurred on only 21% of reaches. The Po basin stayed at 71%.
| River basin | Median, August 2026 (% of normal) | Reaches at their lowest August of 11 | Reaches counted |
|---|---|---|---|
| Danubewith Inn, Drava, Sava, Tisza, Mureș, Olt, Prut | 38% | 76% | 263 |
| Rhinewith Aare, Neckar, Main, Moselle | 45% | 25% | 63 |
| Elbe, Oder and Vistulathe three rivers with their tributaries | 47% | 31% | 117 |
| Loire and Garonnewith Allier, Vienne, Dordogne, Lot | 36% | 21% | 48 |
| Powith Ticino, Adda, Tanaro | 71% | 17% | 30 |
Medians and shares are counted over river reaches of 60-100 km (stretches made of several grid cells, unlike the rest of the report), not weighted by length. The table covers 521 of the 4,643 reaches, 20% of the network length: only rivers with a name in the map data are counted (about 54% of the network length has no name), and rivers outside these five groups, such as the Meuse, Weser and Adige, are not included. The assignment of rivers to basins follows a fixed list; the Elbe, Oder and Vistula are shown together.
Is the model right? Comparison with gauge data
Conclusion: in Sweden and on the Rhine the model shows well where and when water shortages occur, while in the United Kingdom it does so poorly. Its results were compared with gauge readings in three countries. In Germany and Sweden the model tends to overestimate flow at low water, and in the United Kingdom to underestimate it. This means that the actual water shortage there may be larger than the model results indicate, and in the United Kingdom smaller.
- Germany (11 stations): Daily changes in flow in September agreed with the model results. The correlation was 0.91-0.99 on the Rhine and 0.29-0.75 on regulated rivers such as the Elbe and the Oder. The median overestimate of flow by the model was about 22%.
- Sweden (113 stations): The correlation was 0.80. The model captures well the differences between the dry south and the wet north of the country. In the south gauges showed flow at 20-30% of normal, while the model estimated it at about 40%. In the north the values were about 103% (gauges) and 130% (model) respectively.
- United Kingdom (28 stations): Both sources indicate that at more than half of the points flow fell below half of normal: this concerned 61% of gauging stations and 75% of reaches in the model. Agreement for individual rivers was, however, weak (correlation 0.09). This means that the model shows the overall extent of water shortage better than the situation on a specific river.
Gauge data: PEGELONLINE (DL-DE-Zero 2.0), SMHI (CC BY 4.0), Environment Agency (Open Government Licence v3.0), processed by Orbispect.
Data and methodwhere the numbers come from, footnotes, corrections
About this report
The report was prepared by the Orbispect analytics team. First published 30 September 2026, updated 7 October 2026. [Source: Copernicus CEMS (GloFAS) model, Orbispect calculations. Data: CSV, JSON.]
Why a model, and not only gauges
One model lets the Rhine, the Danube and the Vistula be compared on the same day with the same method, which national gauge networks, each with its own system, cannot do. It also keeps working where there is no gauge or where gauge data arrive late. Where a gauge reading exists, it is shown beside the model, and the check against gauges is described below.
What the numbers are
Modelled daily river discharge (flow in m³/s) from a pan-European hydrological model driven by observed weather (a reanalysis). These are not gauge measurements.
River stretches
A river stretch is a grid cell in the top decile of long-term August flow (above about 3 m³/s): 44,779 cells in 37 European countries (Russia and Turkey excluded); the country figures and Fig. 3 cover the 27 countries with at least 300 such cells. Country borders are approximate.
Normal
Normal is the mean of the August flows of 2016-2025 in the same cell; “% of normal” is the August 2026 mean divided by it. For earlier years, each year is compared with the other nine. The baseline is short.
2026 values
2026 values come from the operational run of the model, which works in near real time; earlier years use the final version. In a test on August 2025, the two versions differed by less than 5% in 99% of river stretches. 2026 values may be updated slightly when the model is recalculated. September covers days 1-27.
Limits
Reservoir operation, abstractions and very small streams are only partly captured. Country and regional figures are medians across river stretches, so small rivers weigh as much as large ones.
1991-2020 norm
For context the 1991-2020 norm is also computed (the August mean of those years in the same cell; for years inside the norm, the year is compared with the others). The set of river reaches is the same as in the main analysis. The model record starts in 1991, so "lowest since 1991" does not mean "lowest in the history of measurements".
Alpine images from 1990 and 2026
The images come from the Landsat 5 satellites (9 August 1990, mosaic of two scenes) and Landsat 9 (13 August 2026), at 30 m resolution, with the same brightness scale. They compare two days in the melt season, so they show long-term change, but the size of snow fields also depends on the weather of a given year. Landsat imagery courtesy of the U.S. Geological Survey.
Model and measurement
Model values are estimates; measurements are the gauge readings described under the river cases and in the Poland section. Values are model-based and indicative.
Not a warning
For information only; this is not a flood or drought warning. Only national and regional authorities issue warnings.
What the report does not claim
- The report is not a forecast of river flows.
- The report is not a warning of drought or flood. Warnings are issued by national and regional institutions.
- The values come from the model, not from gauge readings.
- The report does not attribute the drought to climate causes: it describes flows, not their causes.
- Satellite images show the channel and long-term change in one place, not the size of the flow or the drought of a single year.
This report does not contain forecasts of river flows and is not a warning. Official warnings are issued exclusively by the relevant national and regional institutions.
What such data are used for
The maps and tables in this report show where water shortages occur in rivers and how large they are. Such information can help water authorities, emergency services and insurance companies assess the situation. However, the report is not a study prepared for these groups and does not replace the official data of hydrological services. Questions about the data and the possibilities of using them can be sent to: hello@orbispect.com.
Notes and references
- Copernicus Climate Change Service, climate bulletin on summer and river flows, 2 October 2026.
- BAFU/FOEN (Switzerland), “Sommer 2026: Trockenheit und ihre Folgen”, 23 September 2026.
- Euronews, 10 August 2026 (Paks power plant). Telex, 29 July 2026.
- Enerdata, 28 August 2026 (Paks power plant).
- AFP, 12 July 2026 (reactors in France).
- Reuters, 5 August 2026 (shipping on the Rhine, Kaub).
- PEGELONLINE (Germany), raw, unverified readings of the Kaub gauge, to 1 October 2026.
- Fortune, 31 July 2026 (Danube at Budapest).
- Copernicus Climate Change Service, climate bulletin, September 2026.
- Contains modified Copernicus Sentinel data 2024-2026 (Sentinel-2, before-and-after images).
- Generated using Copernicus Climate Change Service information 2026 (ERA5 reanalysis). Neither the European Commission nor ECMWF is responsible for any use that may be made of the Copernicus information or data it contains.
- Polsat News (IMGW data), 3 September 2026, “Alarmingly low level of the Vistula. IMGW issued 91 warnings”.
- Energetyka24, 4 August 2026, “Drought hits Enea power plants. Six units reduce output”.
- Canton of Solothurn, announcement of 11 August 2026 (bans on water abstraction, also for agriculture).
- Own calculations by Orbispect based on the GloFAS model (Copernicus CEMS).
Author and sources
Orbispect analysis desk. First published 30 September 2026, corrected 1 October 2026, expanded 7 October 2026. Data through 27 September 2026. Figures are rounded.
Corrections. If you find an error in the figures or the text, write to the address in the “For media” section. Corrections are published here, with the date and a description of the change.
Disclosure. Orbispect works on the analysis of satellite and modelled data. This report was not commissioned by any customer.
Contains modified Copernicus Emergency Management Service information 2016-2026. Generated using Copernicus Climate Change Service information 2026. Neither the European Commission nor ECMWF is responsible for any use that may be made of the Copernicus information or data it contains.
For the mediaciting, downloadable figures, contact
Journalists, researchers and teachers may quote the numbers in this report and use the images below, with attribution.
How to cite
Orbispect, Europe's river drought 2026, version of 7 October 2026, orbispect.com/rivers. Published 30 September 2026, updated 7 October 2026. Data: CSV, JSON. Licence: Orbispect texts and charts under the CC BY 4.0 licence; the Copernicus data they contain have their own licence, so keep the source notice.
Code to paste on your page (the link to the source is part of the required attribution):
<a href="https://orbispect.com/rivers">Orbispect: Europe's river drought, August 2026</a>, CC BY 4.0Credit line
For Figs. 6-11, which draw on national gauge data, also give the data line printed under Author at the foot of this page; the images carry it.
Press contact
Questions from journalists and requests for other formats: media@orbispect.com
Figures (PNG)
- Fig. 1. Map of river flow in August 2026PNG, 1600 × 1811 px, 1.6 MB
- Fig. 2. Flow at selected river reachesPNG, 2200 × 1402 px, 198 KB
- Fig. 3. Typical river by countryPNG, 2200 × 1804 px, 213 KB
- Fig. 4. August compared with ten other yearsPNG, 1520 × 1096 px, 93 KB
- Fig. 7. Median river flow, 1 August to 27 SeptemberPNG, 1520 × 1254 px, 136 KB
Please describe model figures as modelled estimates and keep the note that this report is information, not a warning.