Every area
monitored from orbit,
every risk priced in.
Orbispect turns satellite data into reliable risk indicators for land, water and climate. We deliver precise analyses from a single parcel to entire regions, and every result comes with its degree of uncertainty.
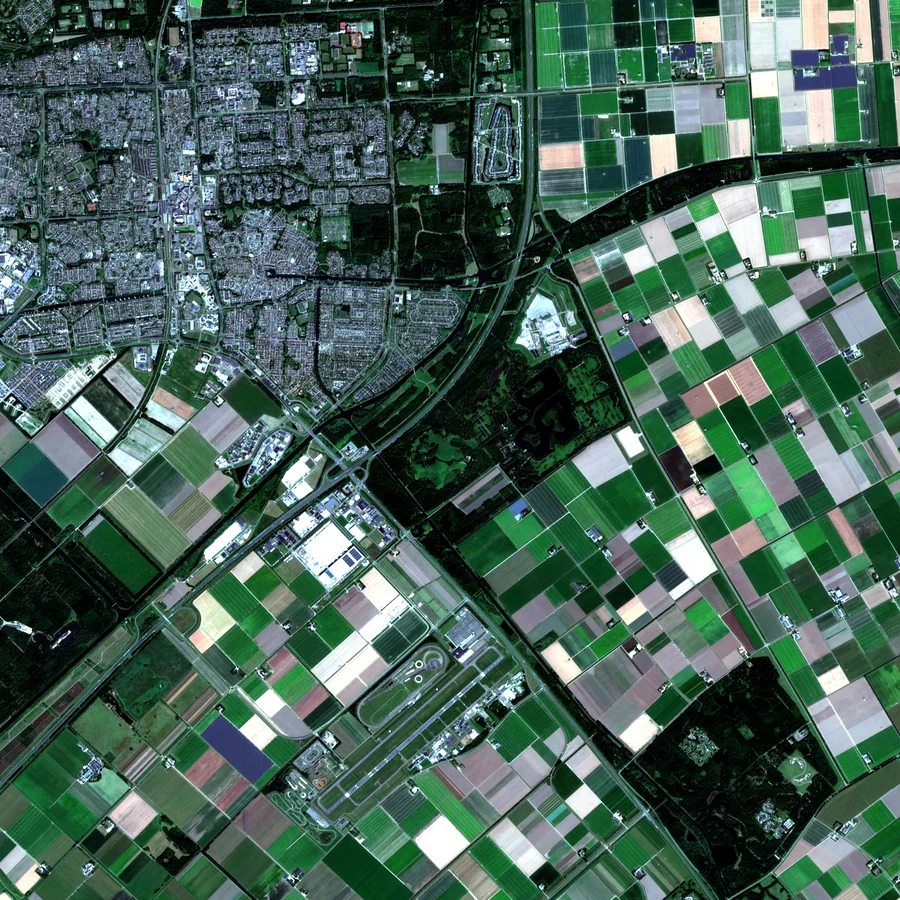
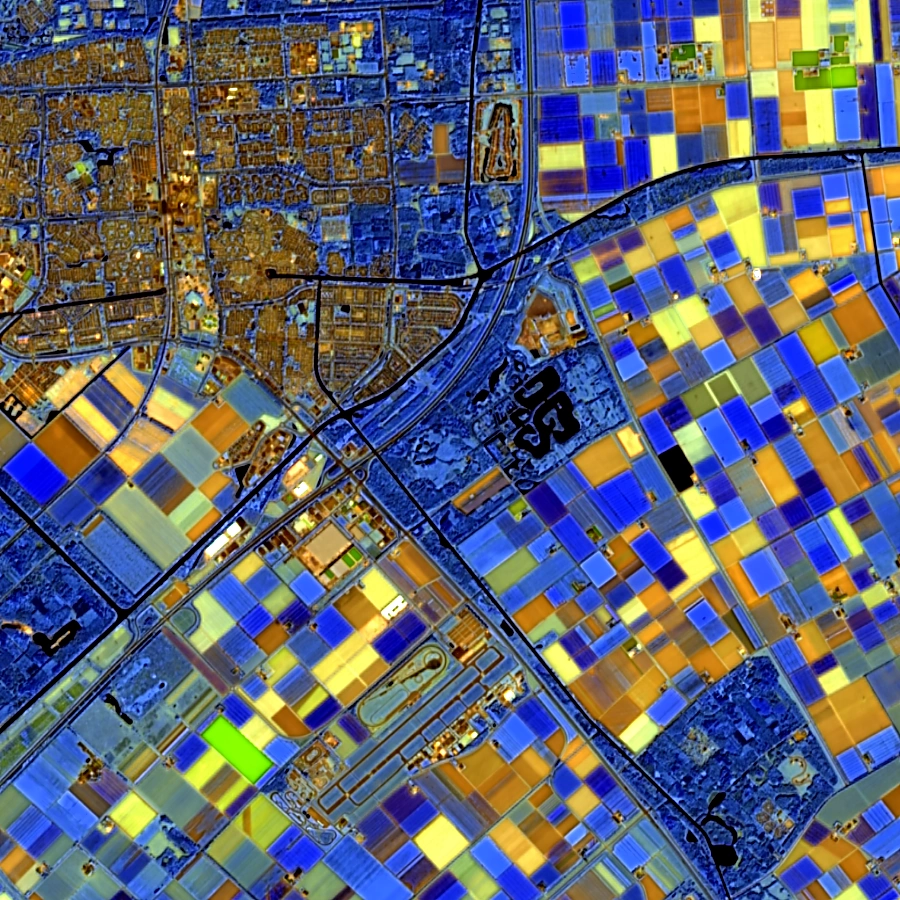
Europe's rivers, running low.
European river flow in August 2026, set against the 2016-2025 norm. The analysis was prepared stretch by stretch from modelled daily discharge. Record-low flows, the lowest in the whole 11-year record, run from the Balkans through Germany to the Rhine and Loire basins. It is worth stressing that these are modelled data, and this year's results are preliminary.
Modelled river flow anomaly across European countries. Not a live system, not a forecast; 2026 values provisional. Contains modified Copernicus Emergency Management Service information 2026.
Read the August 2026 situation report →Agriculture risk, priced per parcel.
Our flagship yield engine, AgroTransformer, is a sequence model of the transformer type, anchored to a process-based crop model. It stands behind the risk products built for institutions that carry agricultural exposure. The water package runs on separate models, and country monitoring packs ship as add-ons.
AgroTransformer
A deep sequence model trained on two decades of official EU yield statistics, fused with daily satellite and climate time series. Rather than guessing from pixels alone, it's anchored to a process crop model, so the network only has to learn what the physics misses.
- District yield forecast as a range: pessimistic / expected / optimistic, never a bare point estimate
- Loss probability per crop: the number an underwriter actually needs
- Analog seasons: "this year is tracking 2018" beats any abstract score
Asset Monitoring
A change-detection capability for infrastructure, land use and unauthorized construction. We hold the imagery archive and the methods to compare two passes of the same place and flag what physically changed between them: built as a capability, and not yet a live operational product.
- Two-pass comparison (T1 → T2): align an earlier and a later acquisition and isolate the difference, not the scene
- Radar × optical: sees through cloud and at night, so a change is confirmed in both structure and reflectance
- Flags what moved: new build-up, cleared land and surface disturbance surfaced for review, each traceable to its two source dates
Conflict-Zone Crop Assessment
Where war or politics cut off official statistics, the fields are still there, and satellites still see them. So we estimate planted area and crop condition in these data-void countries, calibrated against published scientific studies.
- Planted-area estimates for regions where no ministry publishes numbers
- Radar-based monitoring: works through cloud, needs no one on the ground
- Methodology anchored in peer-reviewed literature, uncertainty stated openly
Water security and its balance at regional scale.
We measure water resources across their full depth. We combine the surface-water balance, derived from weather, evaporation and soil moisture, with groundwater data obtained from gravity measurements. One shared algorithm covers both parts of the water cycle.
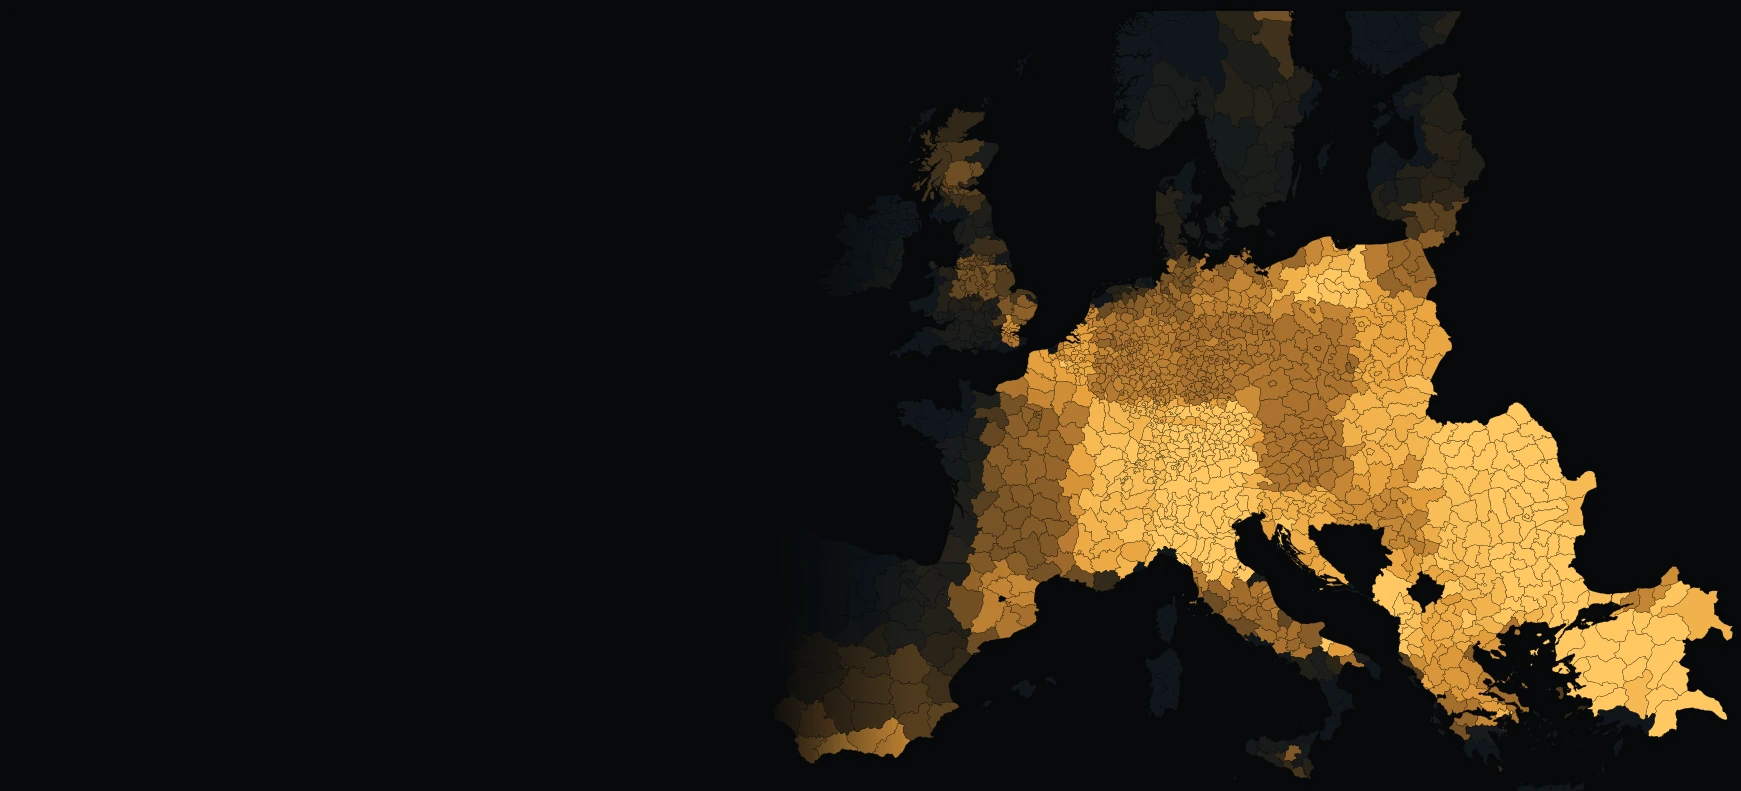
Europe is quietly running dry. We watch it happen from orbit.
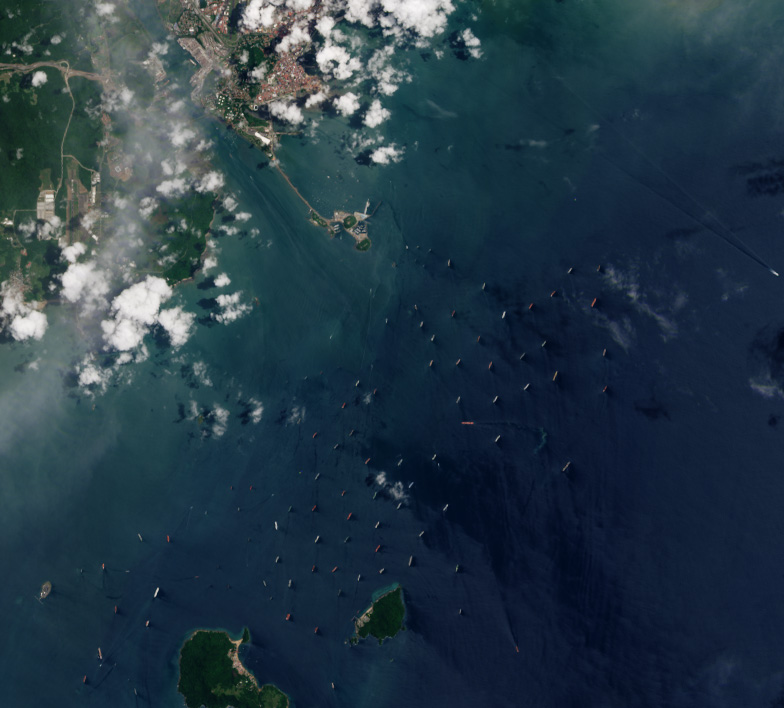
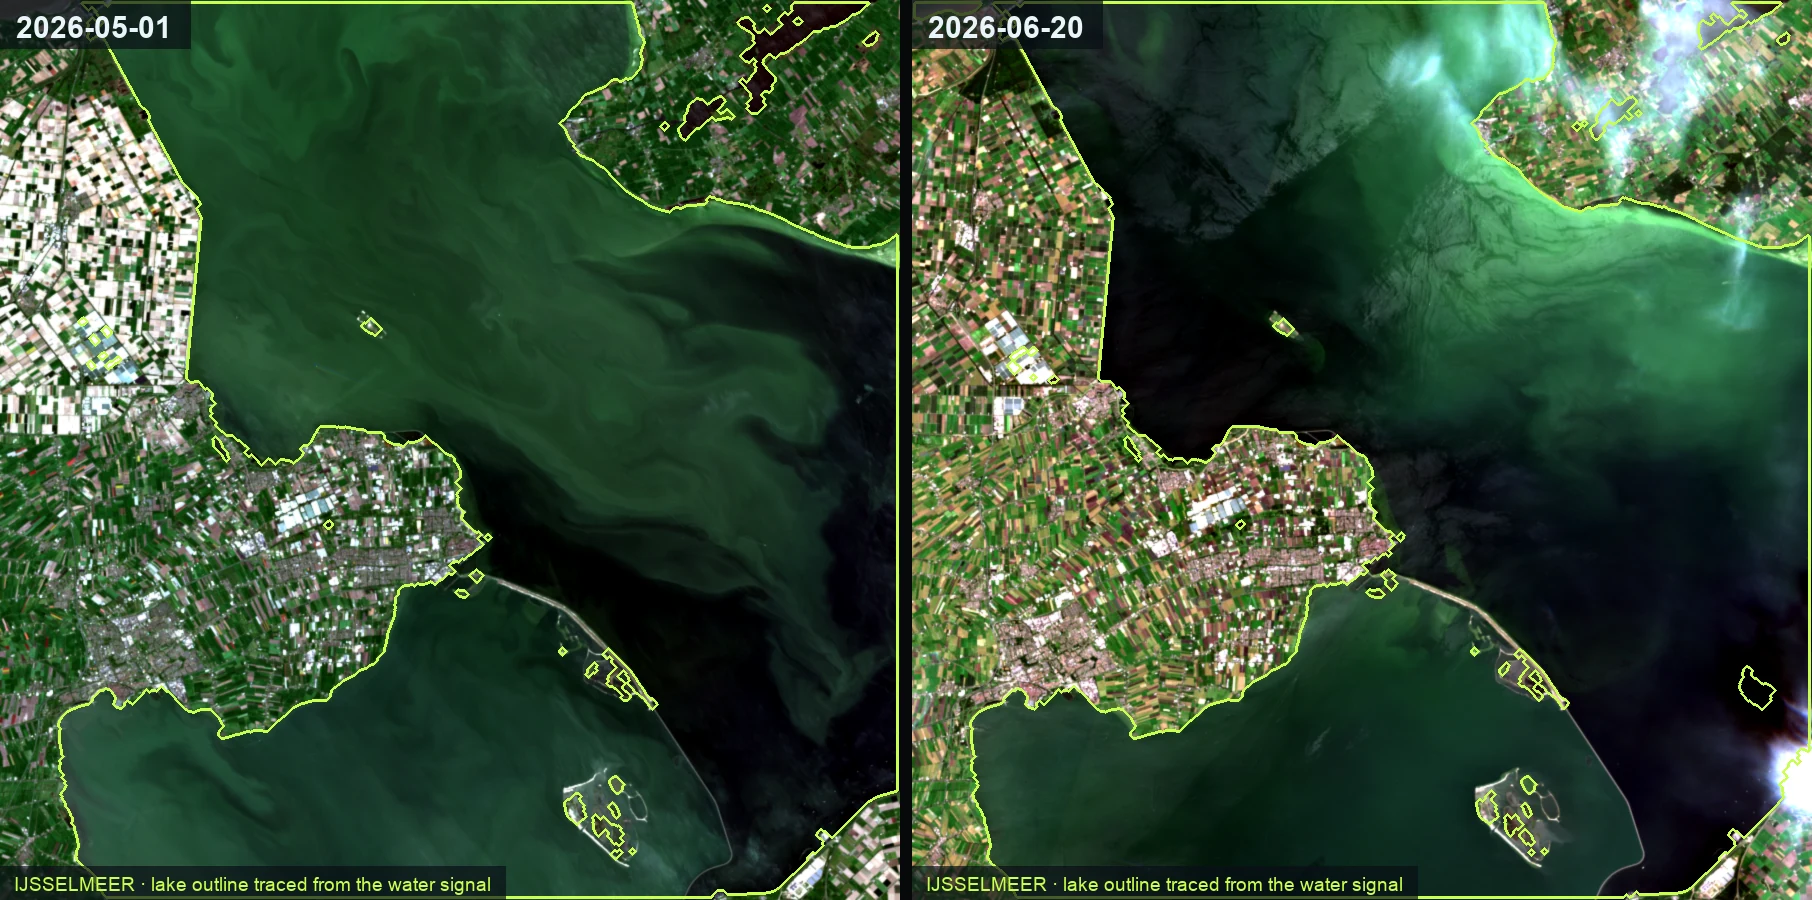
We measure the change in the continent's water mass itself from orbit, one of the most sensitive water signals we can read. Our engine turns that planetary signal into a district-level map of structural decline, where red marks a trend rather than just a dry month.
Water Intelligence Engine
We measure the whole water column and fuse it: deep groundwater from orbital water-mass sensing, surface water and river flow from the balance. The mass signal alone sees regions, streamflow alone sees rivers, and together, downscaled to district level, they become one local decision tool nobody else sells.
- Depletion runway: how many dry seasons until a district hits structural water stress
- Hidden-depletion flags: surface × gravity: aquifers falling while reservoirs look full
- Streamflow & flood outlook: river-flow forecasts and flood exposure per basin, skill published
- Pixel-level uncertainty: every estimate carries its own error bar
Ground Subsidence
The ground moves by millimetres a year: sinking aquifers, settling foundations, slipping slopes, long before a crack is ever visible. We hold the methods and the archive to read that motion from orbit at millimetric precision, built as a capability on layers we already run, though not yet a live operational product.
- Millimetric vertical motion: subsidence and uplift resolved per location, season over season
- Tied to the water column: settlement read against the same aquifer signals our water engine already tracks
- Asset & infrastructure exposure: which sites sit on ground that is quietly sinking
HydroSed: Reservoir & Hydropower
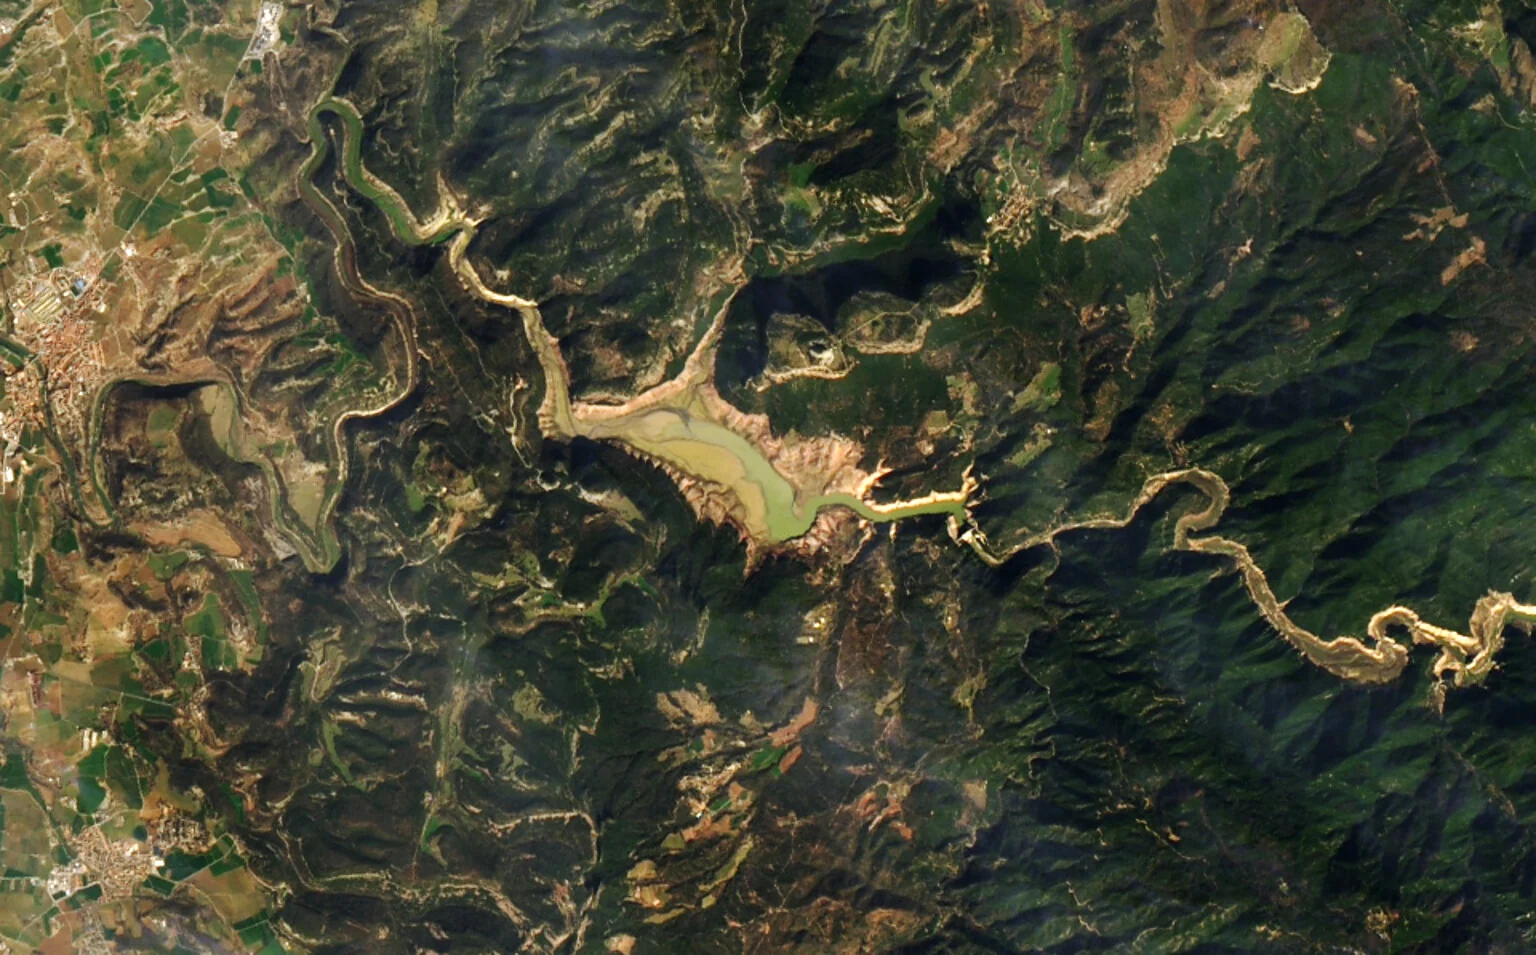
Reservoirs silently lose capacity to sediment every year. HydroSed reads sedimentation, snowpack and inflow from orbit, so generation risk gets read off the whole catchment instead of just the gauge.
- Capacity-loss curve per reservoir: dredging planned on data, not anniversaries
- Snowpack water storage feeding seasonal inflow outlooks
- Catchment erosion sources: where the sediment actually comes from
Herkules: Advanced Tactical GIS & Operational Command System
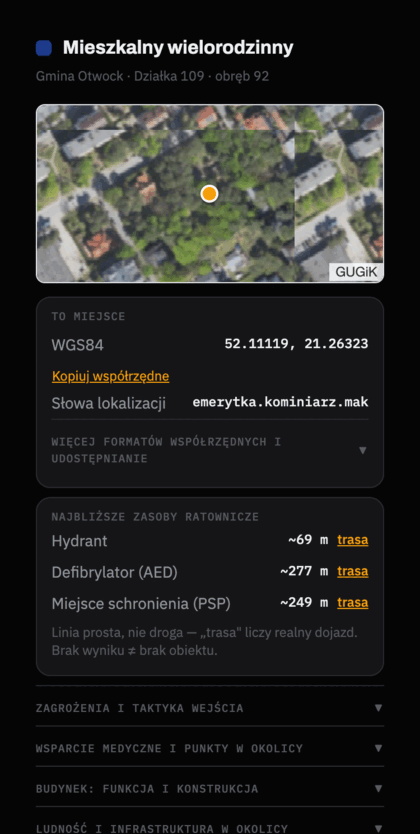
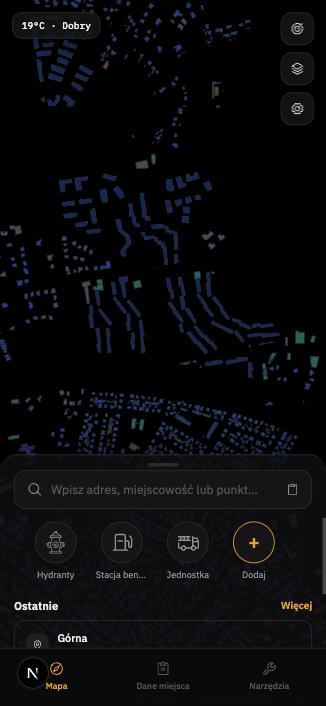
Herkules is an enterprise-grade, high-fidelity GIS platform engineered for state, municipal, and volunteer emergency services. Validated through rigorous field deployment, it bridges the gap between strategic command and first-line tactical operations. The system delivers real-time situational awareness, aggregating critical risk intelligence into a unified operational picture during transit.
- Micro-Level Hazard Mapping: Deep structural and site-specific building vulnerability data.
- Critical Infrastructure Tracking: Instant geolocating of hydrants, AEDs, and designated emergency shelters.
- Dynamic Environmental Telemetry: Live monitoring of weather variables and localized air-quality indexes.
- Tactical Fleet Routing: Smart navigation optimized for emergency vehicle class, weight constraints, and infrastructure limitations.
Herkules is powered by our proprietary geospatial and satellite analytics engine—the same institutional framework utilized for national infrastructure and environmental monitoring—optimized exclusively to secure and accelerate first-responder deployment.
Anyone can read a satellite photo. Our edge is everything else.
Optical imagery is table stakes; every vendor has it. Orbispect fuses the instruments most never touch: orbital water-mass sensing, ground-motion radar, thermal from the ISS, many-band spectral chemistry, plus the mathematics that turns all of it into one answer.
Water-mass from orbit
We sense the change in water mass itself from orbit: the only way to see deep groundwater from space.
Radar interferometry
Millimetre-per-year ground motion from phase shifts between radar passes: subsidence and soil stability, through cloud.
Canopy thermal
High-resolution canopy temperature radiometry: crop water stress detected days before it is visible to any camera.
Many-band spectral chemistry
200+ spectral bands read soil carbon, clay and plant nitrogen as chemical signatures: lab analysis from orbit.
Atmospheric spectrometry
Methane column retrievals screen super-emitters: the climate liability most portfolios cannot see.
Microwave radiometry
Microwaves that penetrate the canopy to read root-zone soil moisture: the variable rain gauges never see.
Thermal time series
Five decades of surface temperature archive: a multi-decade climate baseline.
Assimilation & uncertainty
Ensemble Kalman assimilation, Bayesian structural time series, Gaussian-process error fields, copula risk models: the layer most vendors skip.
We keep the record that officially no longer exists.
Operators and markets quietly restate their numbers after the fact, and only the smoothed, corrected figure survives. We snapshot every feed the moment it publishes and keep every version, so we hold the as-stated vs restated trail nobody else can reconstruct. And history only accrues from the day collection starts: it can't be bought backwards.
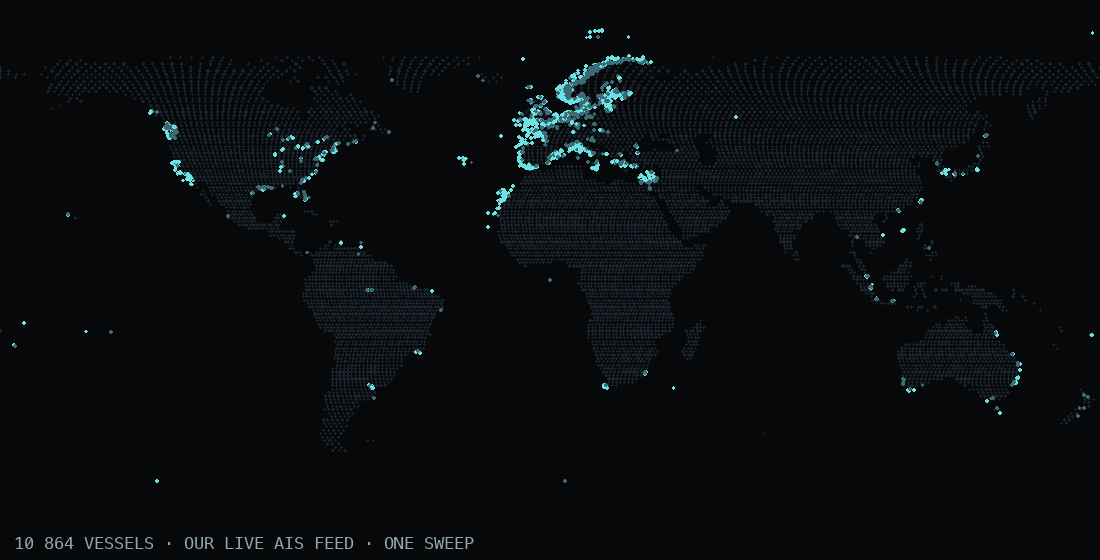
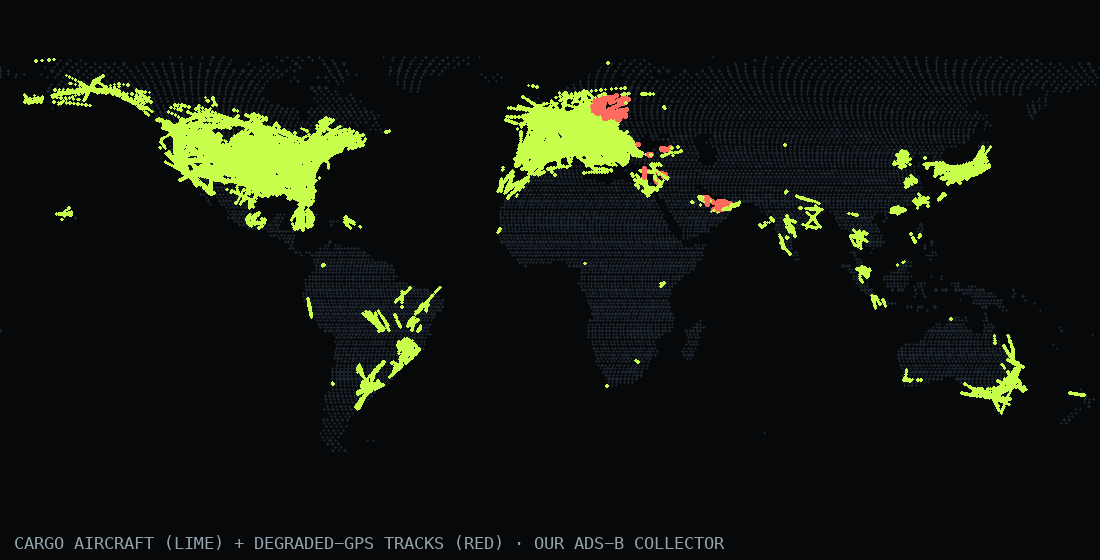
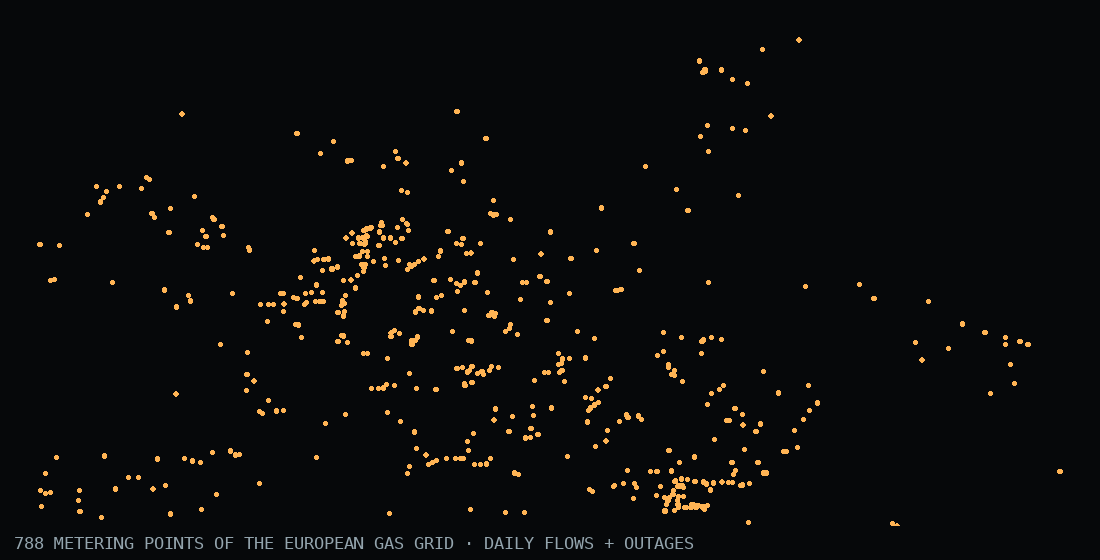
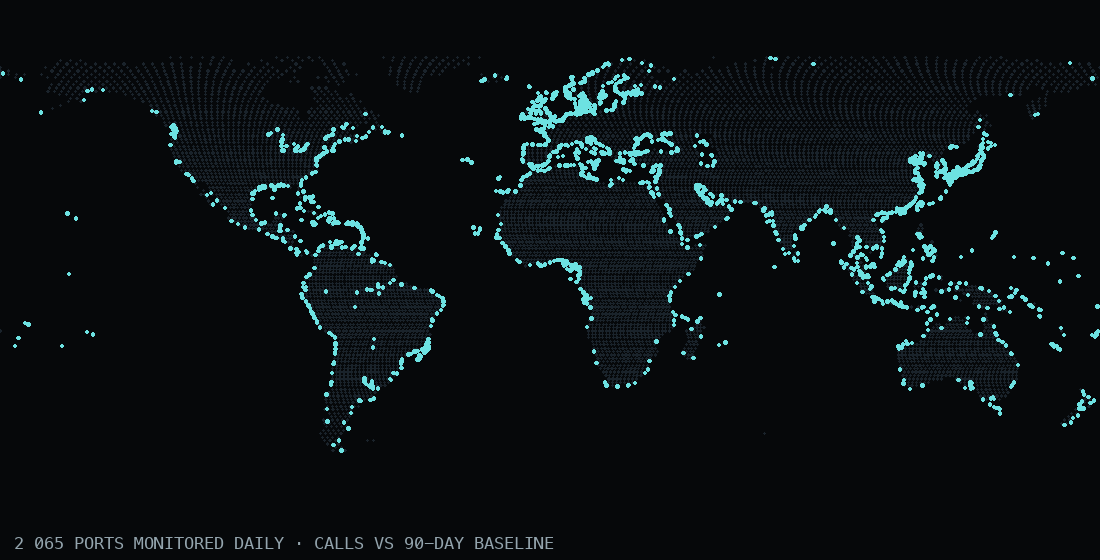
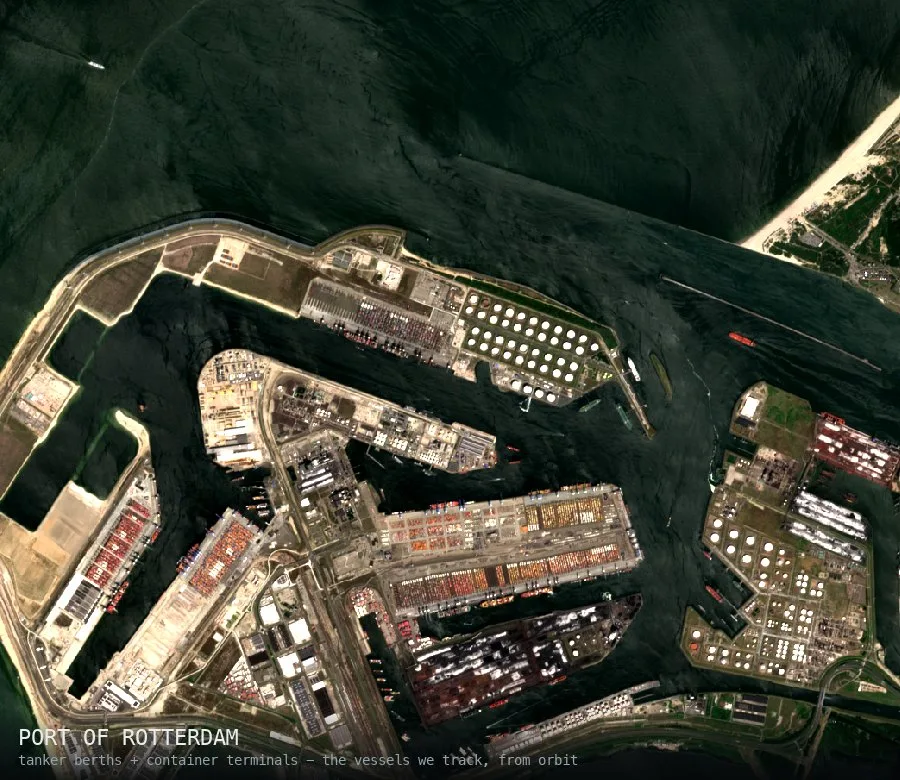
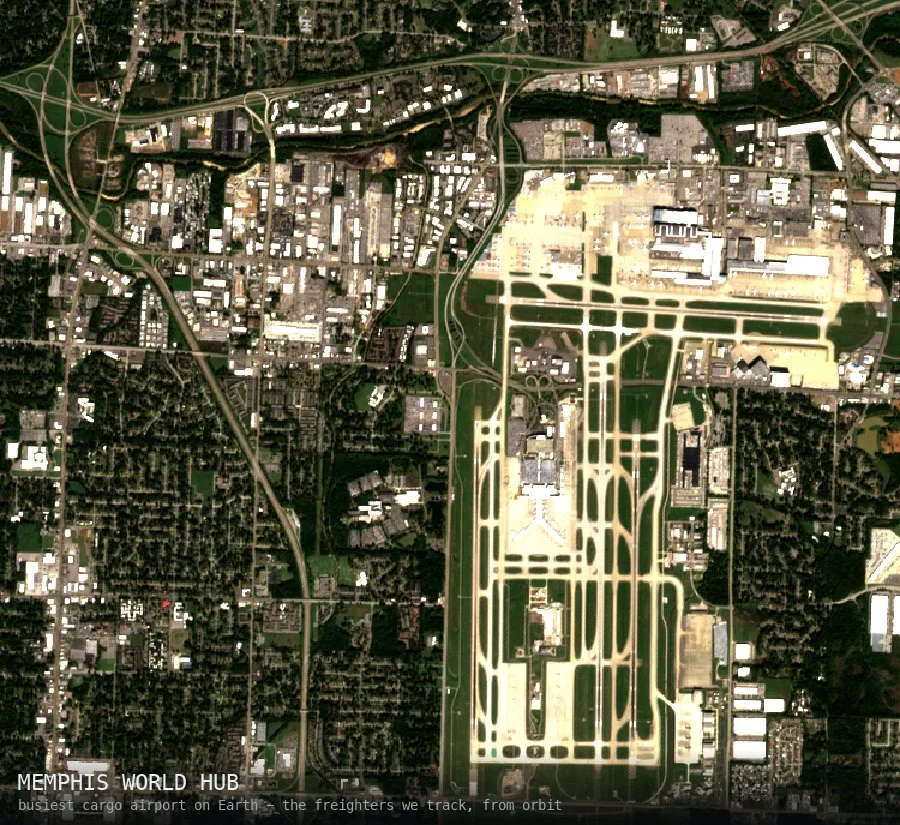
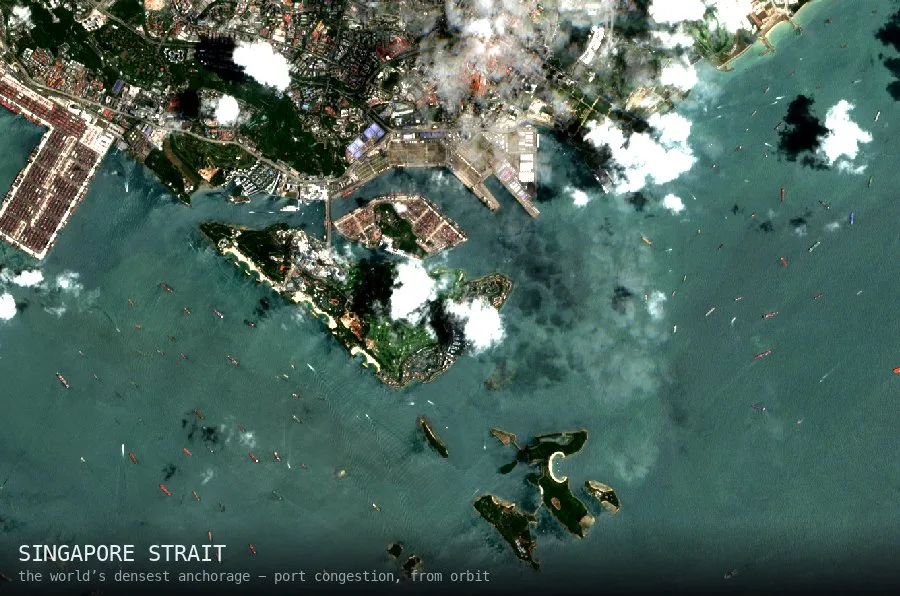
Every estimate ships with a confidence interval, because we'd rather say "we don't know" than fabricate a number. When a source is unavailable, the output says so.
Our models are anchored in peer-reviewed agronomy and hydrology, with citations available to clients and auditors: not proprietary magic.
Designed from day one for CSRD and insurance audit trails: versioned data lineage, reproducible runs, EU data residency.
Built in Poland. Pointed at the planet.
The engine is country-agnostic. The same satellites fly over every basin on Earth. Today the deepest coverage is Central Europe, and every new market is just a configuration away, not a rebuild.
Score your portfolio in 30 days.
A pilot starts with your assets and ends with a clear validation report for your board. This service is designed for insurers, lenders, utilities, and supply chain teams.
Email opens only when you choose it above.
Email opens only when you choose it above.