ORBISPECT
For agri-insurers · agri-finance · large farms & cooperatives

Soil moisture and crop water use, field by field — with a margin your actuary can use.

A weather station tells you what fell on one point. What underwriting and lending actually need is how much water is sitting in the root zone and how fast the crop is using it, across every parcel in the book. We map soil moisture and evapotranspiration from orbit at parcel scale, on a repeating cycle, and deliver each value with a calibrated uncertainty band, so a drought-stress signal can drive pricing, payout triggers and irrigation decisions instead of just colouring in a map.

HEADLINE VALUE

A parcel-scale soil-moisture and evapotranspiration layer with a calibrated prediction interval on every value, benchmarked against in-situ soil and flux stations. It turns the root-zone water balance into a number you can actually underwrite or finance against.

Parcel-scale soil moisture and evapotranspiration mapping
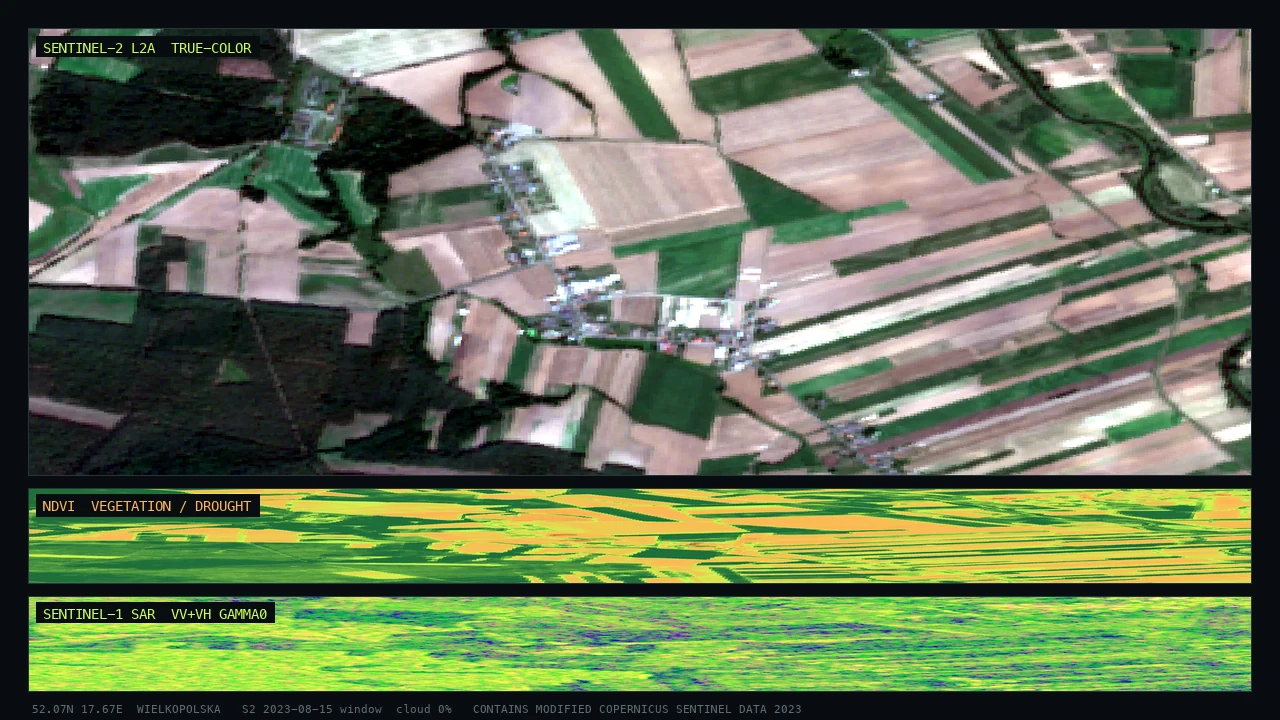
PARCEL-SCALE SOIL MOISTURE & CROP WATER USE · ILLUSTRATIVE RENDER FROM OUR PIPELINEOPTICAL × RADAR × THERMAL × ORBISPECT ENGINE
DECISION SCALE
Parcelresolved to the field, not the weather station — so every parcel in a book carries its own water-balance value
EVERY VALUE SHIPS WITH
Uncertainty banda calibrated prediction interval per parcel; small or fragmented parcels carry a visibly wider band, never an overstated one
WHAT IT MEASURES
Water + ETroot-zone soil moisture and evapotranspiration — the water that arrived and the water the crop is spending
THE OPERATOR CHECKLIST

The questions an actuary and an agronomist both ask.

No single accuracy percentage is quoted below. The differentiator is a calibrated interval on every parcel value, benchmarked against independent soil and flux measurements.

A · ACCURACY & VALIDATION

Can I price and pay out against this?

Yes. Each parcel value arrives as a conformal prediction interval with guaranteed coverage, so the band an actuary loads into a model has a property that actually holds out of sample. Soil moisture and evapotranspiration are benchmarked against in-situ soil-moisture probes and flux (eddy-covariance) reference stations, and the gridded climate inputs feeding the indices get bias-checked against the national meteorological network before any downstream model ever sees them.

  • Independent referees. Soil and flux networks for the product; met stations for the input climate fields.
  • Honest weak spots. Parcels below sensor resolution are flagged with a wider interval and priced accordingly, not hidden.
  • Validation pack. Residual tables and coverage statistics ship with the product and stay current.
B · RESOLUTION & UPDATE FREQUENCY

How fine, how often?

Spatial: mapped at parcel scale, with sub-parcel detail where the field is large enough relative to sensor resolution.

Temporal: refreshed on the satellite revisit cycle through the growing season — optical and thermal depend on clear sky, radar continues through cloud to keep the soil-moisture signal alive.

C · INTEGRATION

How does it reach my systems?

  • API — per-parcel soil-moisture and ET values plus intervals, keyed by parcel ID.
  • GeoTIFF — georeferenced rasters for GIS and farm-management systems.
  • PDF report — portfolio or farm brief for underwriting and credit files.
  • Map layers in your own tools — parcel monitoring delivered as data, not a portal to log into.

Tabular feeds map onto actuarial pricing and loan-scoring pipelines. Rasters import into farm-management and irrigation-planning platforms.

D · TECHNOLOGICAL LIMITATIONS — HANDLED HONESTLY

Cloud, small parcels, and the root zone below the surface

Three honest limits, three mitigations. (1) Cloud blocks optical and thermal sensing, so we maintain continuity with radar, which retrieves a surface-soil-moisture signal through cloud — and we state any residual gap rather than quietly interpolating over it. (2) Small and fragmented parcels fall near or below sensor resolution. Those get flagged and carry a wider interval, so the uncertainty is priced instead of ignored. (3) The root zone sits below what any sensor sees directly. Satellites observe the surface and the canopy, so root-zone water gets inferred from the surface signal plus the modelled water balance and crop water use, with the interval widening to reflect that inferred depth.

Where the signal runs thin, the band runs wide and visible. That's the whole policy — never a confident number hiding a caveat.

E · COMPLIANCE & STANDARDS

Where it fits

Outputs support parametric and indemnity agri-insurance design, CSRD-aligned water and climate disclosure for agribusiness, and an auditable basis for credit decisions. Processing runs under EU data residency.

We don't claim a regulatory product certification we don't hold, and we say so plainly. The layer feeds the actuarial, credit and reporting processes you already run.

F · DELIVERY FORMATS

What you actually receive

  • API with per-parcel soil-moisture + ET + interval
  • GeoTIFF raster layers
  • Vector parcel tables (CSV / GeoPackage)
  • PDF portfolio and per-farm briefs
  • API and map-layer access
G · HORIZON

What time frame it speaks to

The product delivers a near-real-time monitoring view of root-zone water and crop water use across the season, plus a short-range drought-stress outlook wherever soil moisture and weather inputs are well observed. Forward-looking values carry their own widening band, so a stress warning always comes paired with a quantified confidence instead of being presented as certainty.
SPECIFICATION AT A GLANCE

One table for the procurement file.

ATTRIBUTESOIL MOISTURE & ET · AGRONOMY INTELLIGENCE
Primary clientAgri-insurers, agri-finance, large farms and cooperatives
Spatial resolutionParcel scale, with sub-parcel detail on larger fields
Update frequencySatellite revisit cycle through the season; radar continues through cloud
UncertaintyCalibrated prediction interval (conformal, guaranteed coverage) on every parcel value
Validation referenceIn-situ soil-moisture probes and flux stations; met network for input climate fields
DeliveryAPI · GeoTIFF · vector parcel tables · PDF report · API & map layers
IntegrationActuarial / credit pipelines; farm-management and irrigation platforms
HorizonNear-real-time monitoring plus short-range drought-stress outlook
Key limitationCloud, small parcels and root-zone depth — mitigated by radar, wider intervals and water-balance inference
Compliance relevanceParametric / indemnity insurance design, CSRD-aligned disclosure; EU data residency
KNOWN LIMITS

What this product does not do.

// STATED PLAINLY
  • It does not measure the root zone directly. Root-zone water is inferred from the surface signal and water balance, with a wider interval for the inferred depth.
  • Small, fragmented parcels carry wider uncertainty. They are flagged and priced accordingly, not silently smoothed over.
  • Yield-anomaly forecasting is a separate, pilot-stage capability. This layer ships soil moisture and ET; yield forecasting is not claimed as production here.
  • No trained-model accuracy headline is claimed here. The guarantee is calibrated interval coverage, validated against soil and flux networks.
CASE STUDY

Evidence, when the pilot closes.

PILOT SLOT TO BE POPULATED

Agronomy / agri-insurance pilot

This slot is reserved for a completed design-partner pilot. We don't publish a case study before the work exists — when one closes, it will carry the portfolio or farm context, the comparison against that client's own ground reference, and the realised interval coverage at parcel scale.

CLIENT TYPE
agri-insurer / lender / large farm — to be confirmed
VALIDATION RESULT
vs soil / flux reference — pending
REALISED COVERAGE
parcel-level interval coverage — pending

Request the validation pack.

Residual tables against soil and flux reference, the interval-coverage protocol and the small-parcel flagging rules all ship under NDA with every pilot.

Start a pilot See how we validate