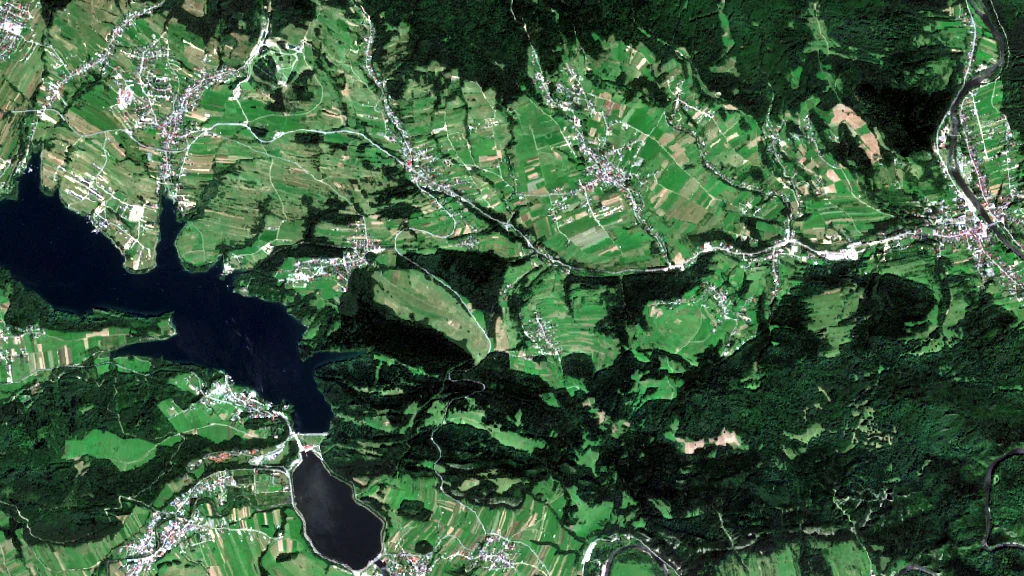
No measured accuracy percentage is quoted below, on purpose. What sets this apart is that every estimate ships with a calibrated, validated uncertainty band, and the method's blind spots are stated rather than hidden.
A · ACCURACY & VALIDATION
How do I trust a number from space in a dam-safety file?
You trust it because it arrives with its limits attached. Each estimate is delivered as a conformal prediction interval with guaranteed coverage — a turbid plume, a partial cloud or a low sun angle widens the band instead of producing a confident wrong answer. The surface signal is benchmarked against in-situ measurements, too. Where you hold sediment cores, turbidity probes or a recent bathymetric survey, those become the reference the satellite layer is checked against.
- Anchored to your survey. A bathymetric survey is the ground truth that calibrates the inter-survey signal — we extend it, we do not overrule it.
- Honest flagging. Scenes too clouded or turbid to resolve are flagged, not silently filled.
- Validation pack. The comparison protocol and residuals ship with the product and stay current.
B · RESOLUTION & UPDATE FREQUENCY
How fine, how often?
Spatial: per-pixel surface mapping across the reservoir footprint, resolving plumes, near-shore deposition zones and the inflow delta separately from open water.
Temporal: refreshed on the satellite revisit cycle — optical passes depend on clear sky, while radar water-extent continues through cloud.
C · INTEGRATION & SCADA
Does it reach my control room?
- API — time series and per-zone values for programmatic pull.
- GeoTIFF — georeferenced layers for GIS and asset records.
- PDF report — survey-style brief for the dam-safety file.
The API exposes standard tag-style values and intervals that a SCADA / historian integration can ingest as derived points alongside existing instrumentation.
D · TECHNOLOGICAL LIMITATIONS — HANDLED HONESTLY
Optical light cannot see through deep or very turbid water
This is the central honest limit. Optical sensing reads the surface and near-surface; it cannot directly measure deposition on the bed of a deep reservoir, and very turbid water saturates the signal outright. A satellite does not replace a survey boat, and we do not pretend otherwise. So we mitigate it three ways. First, we infer bed accumulation from the surface sediment budget — what the catchment delivers and what settles — calibrated against your bathymetry. Second, we fuse radar-derived water extent and level so storage change is still tracked when optical is unusable. Third, every inferred value carries a wider interval the further it sits from direct observation, which keeps the uncertainty visible instead of buried.
Cloud cover interrupts optical passes. We state the gaps explicitly and lean on radar to keep extent continuity through them.
E · COMPLIANCE & STANDARDS
Where it fits dam-safety practice
Outputs are designed to support periodic bathymetric survey obligations and dam-safety monitoring regimes, not replace them, and they give you an auditable inter-survey record. Processing runs under EU data residency.
We do not hold a dam-safety certification or regulatory seal, and we are not going to claim one. What the product does is feed the file your engineers and regulators already maintain.
F · DELIVERY FORMATS
What you actually receive
- API time series with value + interval per zone
- GeoTIFF raster layers (sediment / turbidity / extent)
- Vector tables (CSV / GeoPackage)
- PDF survey-style reports
- SCADA / historian-ingestible feed
G · HORIZON
The window it covers
HydroSed is primarily a monitoring and trend product. It closes the multi-year gap between surveys with a near-continuous record and a capacity-loss trajectory. Where inflow and catchment delivery are well observed, it also supports short-range outlook on sediment-load and turbidity events tied to high-flow inputs, always with the uncertainty band attached.