ORBISPECT

Every river — including the ungauged ones — read from orbit before a gauge sees it.

A river gauge is really a confession after the fact — it tells you what has already passed the post, nothing more. And most of the world’s rivers have no gauge at all. So we read the river network the other way round, from the contributing catchment downward: observing snowpack water content, rainfall, evapotranspiration and soil moisture from orbit, then resolving the flow reach by reach across basins that have never carried an instrument. Each forecast arrives as a calibrated scenario band rather than a single deceptive line, so turbines, flood reserve and treaty exposure all get set against an honest, quantified range.

A catchment-wide streamflow and low-flow outlook, with a calibrated P10–P90 band on every horizon, extended into ungauged basins from the physics of the catchment itself. Where gauges exist it is benchmarked river by river against national networks, with skill reported per basin instead of buried in a flattering average.

1,514
reaches resolved — every reach in the network, gauged or not
582,642km
of river network, read from the contributing catchment
P10–P90
calibrated band on every horizon — never a single deceptive line

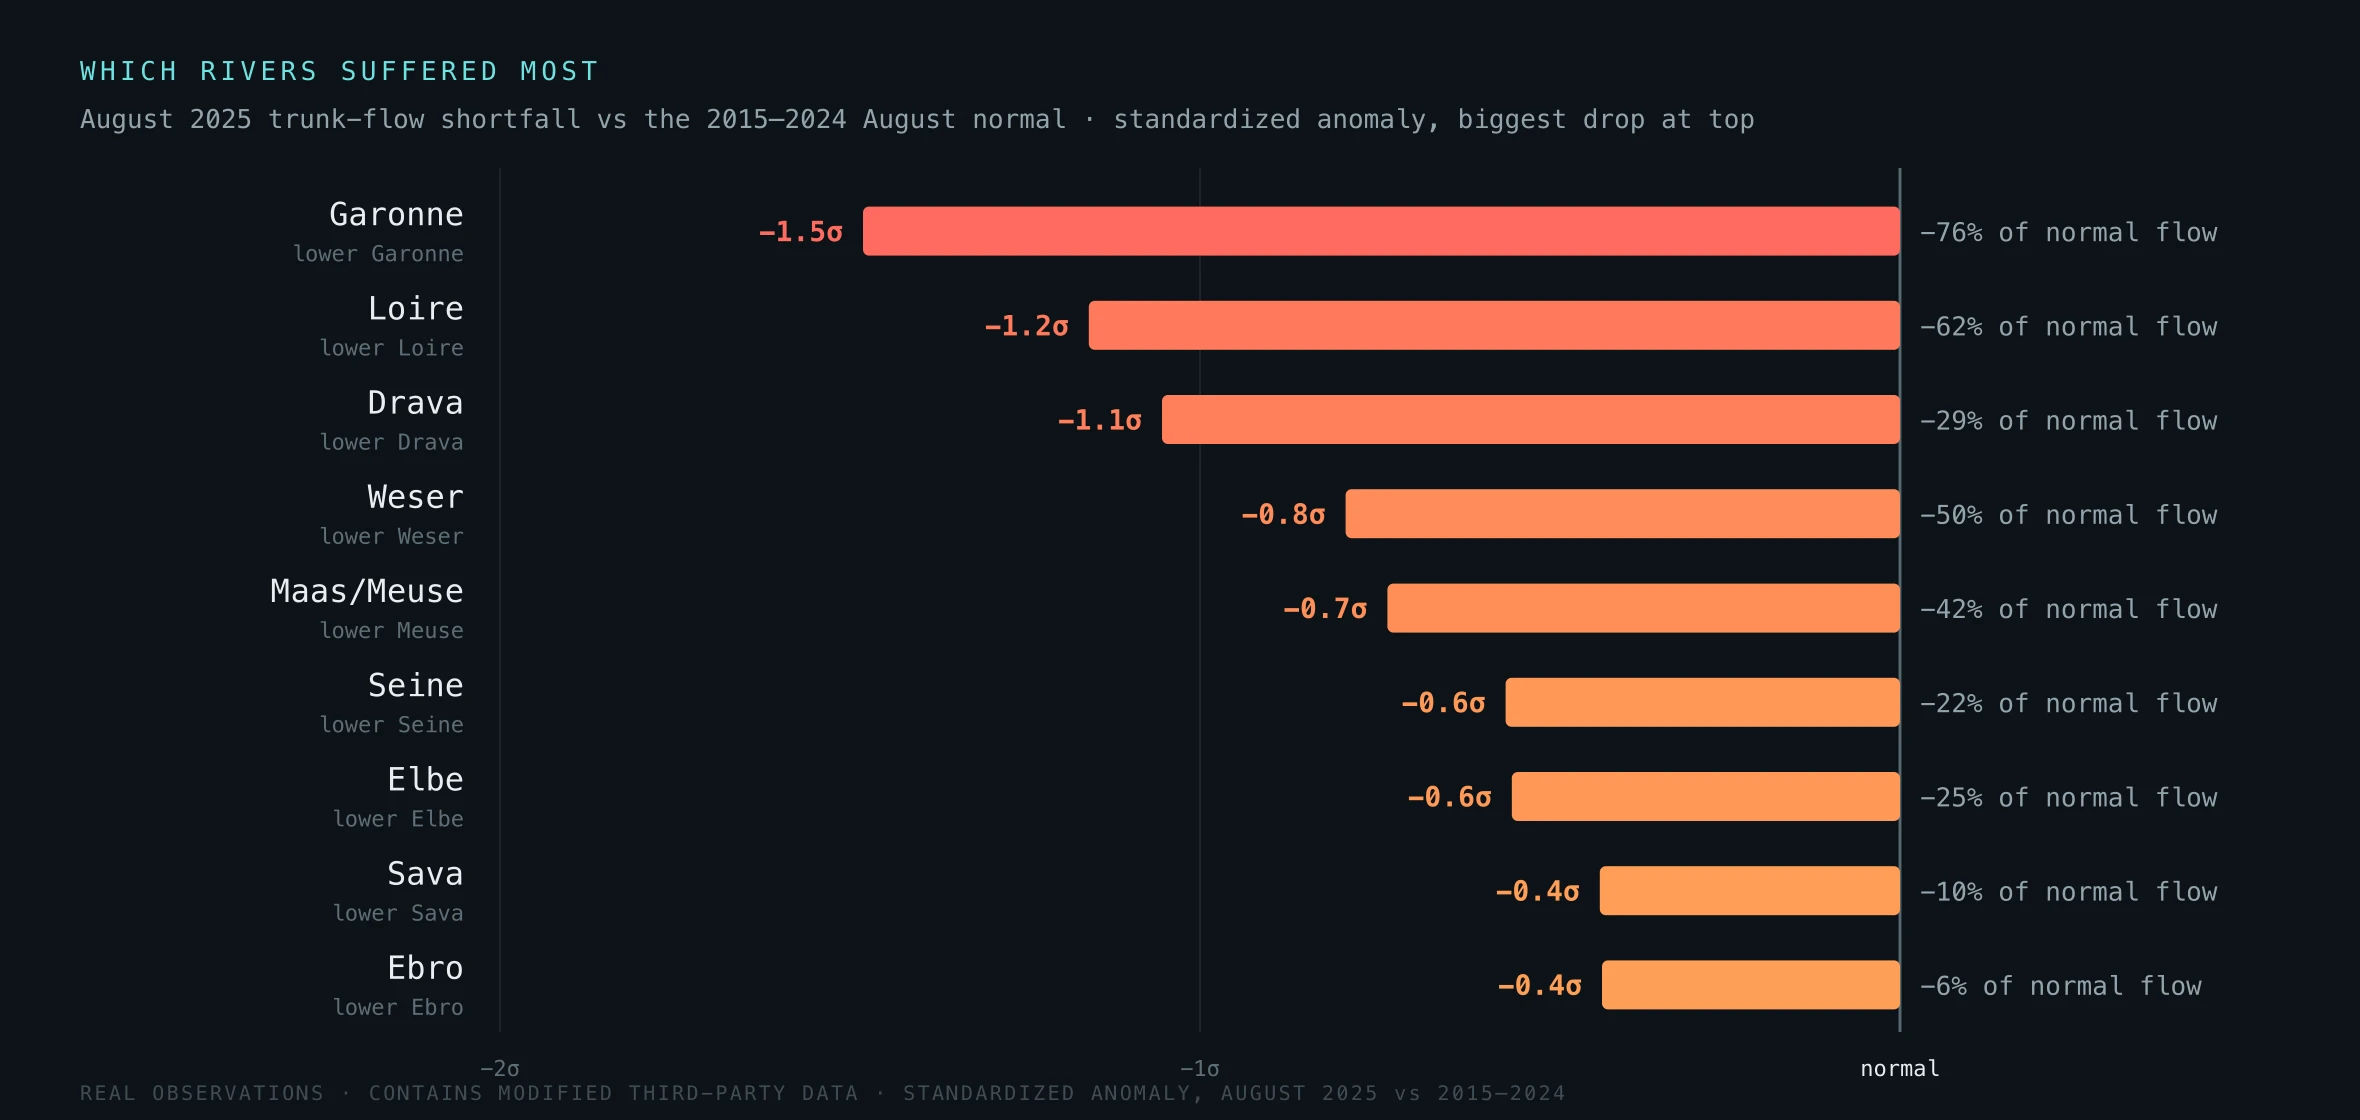
August 2025, ranked by how far each reach fell.

Ranked horizontal-bar chart of the major European river reaches that ran most below normal in August 2025, measured as a standardized discharge anomaly against the 2015-2024 August normal, biggest drop at the top
WHICH RIVERS SUFFERED MOST · AUGUST 2025 TRUNK-FLOW SHORTFALL vs THE 2015–2024 NORMAL · REAL OBSERVATIONS, RANKED BY SEVERITYSTANDARDIZED DISCHARGE ANOMALY · CONTAINS MODIFIED THIRD-PARTY DATA

The chart above is not a projection. It ranks Europe’s major river reaches by how far their trunk flow fell below normal in August 2025, each bar a standardized discharge anomaly measured against that same reach’s own 2015–2024 August record, biggest drop at the top. The Atlantic-facing basins took the hardest hit. The Garonne ran roughly three-quarters below its August normal, the Loire close to two-thirds down, and the Drava, Weser and Meuse were all sharply drawn down behind them. These are measured shortfalls, reach by reach, not a single continental average that would have hidden exactly where the water went missing.

And that is the whole problem in one view. The places where low flow bites hardest — headwaters, tributaries, the small basins that feed a hydropower scheme or a city intake — are exactly the places where a national gauge network thins out. Orbit does not thin out. It reads the filled and the unfilled, the watched and the unwatched, on the same pass.

Five things a river won’t tell you — but the catchment will.

No pitch in this section, just the physics. Whether a basin floods, runs dry or holds steady is usually decided upstream, days to months before any of it reaches a gauge. These are the parts most people outside hydrology never hear about.

Most rivers are unmeasured. Only a small share of the world’s river length carries a working gauge, and the count of active stations has been falling for decades even as droughts and floods intensify. The unwatched reach is the norm, not the exception. A gauge is also a rear-view mirror: it reports water that has already passed one fixed cross-section, recording what left rather than what is still on its way down the network.

Summer’s drought is written in winter. In snowmelt basins, much of the warm-season flow is locked into the snowpack months earlier. Weigh that snow from orbit and a low-water summer becomes visible a season ahead, long before the river itself shows it. The same storm can flood a basin or simply vanish into it — whether rain turns into a flood or soaks away harmlessly comes down to how wet the soil already was before the first drop fell, so rainfall totals on their own never tell you which basin is dangerous today.

Rivers keep falling after the rain stops. Between storms, flow is sustained by slow groundwater. A river can keep dropping for weeks after the last rain simply because the underground store is draining, which is why a long dry spell is governed by baseflow rather than by whatever rain is forecast next.

The rivers no instrument watches — read anyway.

Most rivers are ungauged. A gauge is a pole in the water with a budget behind it, and budgets concentrate on the big, navigable, politically visible reaches. The headwater that fills a reservoir, the tributary that floods a town, the cross-border stretch where nobody owns the meter — these run blind. And when a gauge does exist, it only answers one question, at one cross-section, for water that has already gone by.

So we invert the geometry. Instead of waiting at a point for water to arrive, we observe the contributing catchment that produces the flow: the snowpack holding next season’s melt, the soil moisture deciding whether rain runs off or soaks in, the rainfall and evapotranspiration that close the water balance. A hydrological model, anchored to that physics and corrected wherever a gauge exists, resolves discharge along every reach of the network, gauged or not. The ungauged basin isn’t skipped — it's estimated from the same observed inputs as its measured neighbours, and it ships with a wider, honest uncertainty band to show for it.

This is the part of the product with no substitute. A gauge network can only report where it has gauges, and a catchment read from orbit reaches the reaches that matter precisely because nobody else can see them.

Six things the satellites weigh — and how they add up to a flow.

A river’s flow is not a single measurement. It is a running account of water arriving, held, and leaving a catchment, and from orbit we read that account layer by layer. The snowpack is next season’s flow still locked upstream — weigh how much melt it holds and you already know much of the summer’s water before a drop of it runs. Soil moisture decides the fate of the next rain: onto ground already wet it runs straight off into the river, onto dry ground it soaks away and never reaches the channel. Rainfall is the forcing that drives the whole balance, and evapotranspiration is the water leaving the catchment back to the air — the two ends of the same ledger.

Beneath them sits deep groundwater, the slow store that keeps a river alive between storms, draining for weeks after the last rain. And the shape of the land itself — the terrain, together with the millimetric ground motion we track alongside it — decides where water concentrates and where it drains away before it ever reaches a gauge.

Fused into one physical water balance, these six readings resolve flow for every reach, gauged or not. That fusion is why a basin that has never carried an instrument can still be read — with an honest uncertainty band, not a confident guess.

How the forecast is built — and how you can check it.

No single accuracy percentage does this justice, and quoting one would be dishonest. Two things matter instead. Every forecast arrives as a calibrated range, and the skill behind it is published basin by basin so it can be audited, not just taken on trust.

A range, not a line. Every forecast ships as a scenario band, a P10–P90 spread on each horizon, never a single deceptive number. The band is verified out of sample: when it states P10–P90, realised flow actually falls inside it at that frequency. That calibration is what an operator schedules turbines against and an underwriter prices exposure against. It also widens automatically where a catchment is hard to forecast, so a low-predictability basin shows a visibly wider range instead of a confident wrong answer.

Checked river by river. Skill gets benchmarked basin by basin against the national river-gauge networks — the independent referee — and the comparison is re-run with every release. Where a basin falls below the skill threshold, it ships labelled low confidence rather than dropped or dressed up. The per-basin skill tables travel with the product, kept current for the length of the contract.

How fine, how often. Flow is resolved per catchment and per gauge node, with the contributing area read pixel by pixel rather than as a single point, refreshed as each new satellite pass arrives. Where cloud thins the optical record, radar keeps the catchment observed through weather that would otherwise blind it.

Honest lead time. Lead time is not uniform, and we are not going to pretend otherwise. It runs longest — days to weeks — where inflow is snowmelt-driven and the catchment is densely observed, and it shortens for flashy, rain-driven floods that build in hours. So the horizon spans that short flash-flood range out to a multi-week outlook for snowmelt basins, and every horizon carries its own band, wider the further out it reaches.

What it is, and what it is not. The outputs support flood-risk assessment, water-agency planning and dam operating-rule reviews, on an auditable basis that can be checked against national gauges, and processing runs under EU data residency. We hold no official hydrological-forecasting designation, and we are not claiming one — the product complements the national services rather than impersonating one. It reaches you as an API of per-node flow scenarios, catchment and inundation rasters, and a plain-language basin outlook.
Request the validation pack.

Per-basin skill tables, the band-coverage protocol and the basin-confidence labelling rules ship under NDA with every pilot.

Start a pilot See how we validate